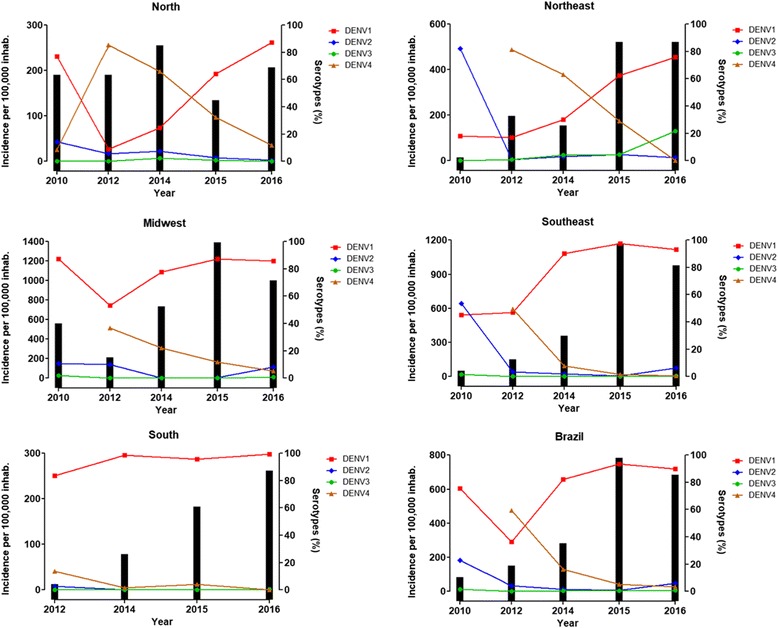
Fig. 1.

Dengue incidence associated with DENV serotypes in Brazil from 2010 to 2016. Bars: dengue incidence per 100,000 inhabitants related to the left Y-axis. Lines: DENV serotype percentage observed in samples analyzed by LACENs related to the right Y-axis. Calculations were performed for each region for every year using data available from the Brazilian Ministry of Health. 2010 data: up to the 9th week of monitoring. 2016 data: up to the 27th week of monitoring
