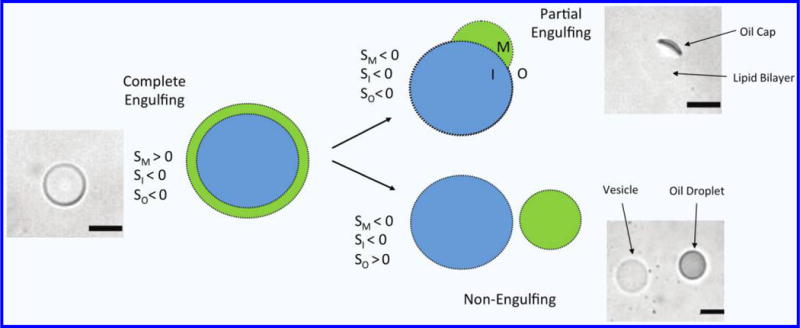
Figure 2.

Illustration and phase contrast images of possible double emulsion equilibrium morphologies based on the values of the spreading coefficient for each fluid phase. Scale bars are 20 μm.

Illustration and phase contrast images of possible double emulsion equilibrium morphologies based on the values of the spreading coefficient for each fluid phase. Scale bars are 20 μm.