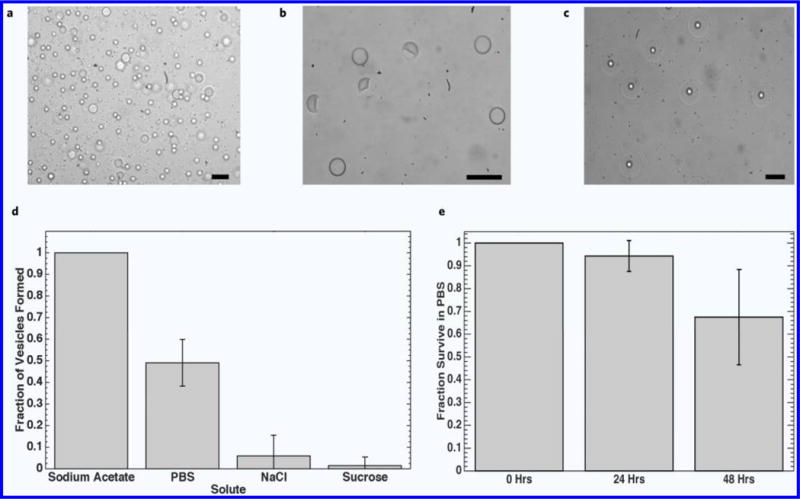
Figure 3.

Phase contrast images demonstrating effect of lipid and cholesterol concentration on SCM formation in 1× PBS. (a) 5 mg mL−1 DOPC in middle phase. (b) 5 mg mL−1 DOPC + 2.5 mg mL−1 cholesterol in middle phase. (c) 10 mg mL−1 DOPC + 5 mg mL−1 cholesterol in middle phase. Dewetting characteristics and vesicle survival. (d) Fraction of vesicles seen after 10 minutes in various electrolytic solutions (n = 4). No dewetting was observed when vesicle solution was diluted with deionized water. (e) Survival characteristic of vesicles in PBS after dewetting (n = 9). Scale bars are 50 μm.
