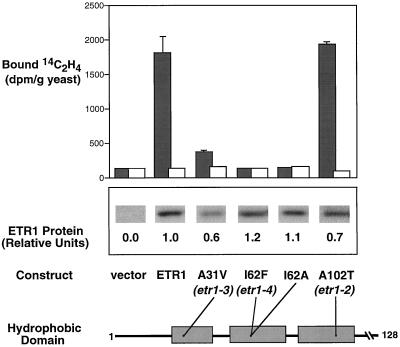
Figure 2.
Analysis of ethylene binding by mutant ETR1 proteins. A schematic of the amino acids 1 to 128 of the ETR1 protein is shown, and relative positions of amino acid changes (•) in the three hydrophobic domains are included. For site-directed mutations, single-letter abbreviations are noted for amino acids. Dark bars represent the amount of [14C]ethylene bound (disintegrations per minute per gram of yeast) by transgenic yeast incubated with 0.07 μL L−1 [14C]ethylene. Samples were run in triplicate and sd bars are shown. White bars represent the amount of [14C]ethylene bound (disintegrations per minute per gram of yeast) by single samples of transgenic yeast incubated with 0.07 μL L−1 [14C]ethylene and 1,000 μL L−1 [12C]ethylene (background binding). Total yeast proteins were isolated and analyzed by western-blot analysis. The expression level of each of the mutants was determined by densitometric quantification of western blots, and is reported as expression level relative to wild-type ETR1 protein.

