

Abstract
Purpose
Evaluate the relationship of leptin receptor (LEPR) rs1137101, fat mass obesity-associated (FTO) receptors 9939609, melanocortin-4 receptors (MC4R) rs2229616 and rs17782313, and proliferator-activated receptor-gamma (PPARG) rs1801282 with clinical and metabolic phenotypes in prepubertal children.
Research question
What is the effect of polymorphisms on clinical and metabolic phenotypes in prepubertal children?
Methods
A cross-sectional descriptive study was performed to evaluate anthropometric features, percentage body fat (%BF), biochemical parameters, and genotype in 773 prepubertal children.
Results
FTO rs9939609 was associated with an increase in body mass index (BMI) and BMI z-score (zBMI). MC4R rs17782313 was associated with a decrease in BMI and +0.06 units in zBMI. LEPR, and PPARG-2 polymorphisms were associated with decreases in BMI and an increase and decrease units in zBMI, respectively. The homozygous SNPs demonstrated increases (FTO rs993609 and MC4R rs17782313) and decreases (LEPR rs1137101, PPARG rs1801282) in zBMI than the homozygous form of the major allele. In the overweight/obese group, the MC4R rs17782313 CC genotype showed higher average weight, zBMI, waist circumference, waist-circumference-to-height ratio, and waist-hip ratio, and lower BMI, mid-upper arm circumference, calf circumference, and %BF (P< 0.05). FTO rs9939609 AT and AA genotypes were associated with lower triglycerides (P < 0.05).
Conclusions
We showed that MC4R rs17782313 and FTO rs9939609 were positively associated with zBMI, with weak and very weak effects, respectively, suggesting a very scarce contribution to childhood obesity. LEPR rs1137101 and PPARG-2 rs1801282 had weak and medium negative effects on zBMI, respectively, and may slightly protect against childhood obesity.
Keywords: Polymorphisms, Anthropometry, Body fat, Biochemical parameters, Children
Introduction
Obesity prevalence has increased during the past century and the World Health Organization (WHO) estimates that the number of overweight/obese young children will reach 70 million in 2025 [1]. Obesity is a chronic disease with multifaceted etiology [2, 3]. Socioeconomic changes during the last decades have contributed to these phenomena, including the increased availability of high-fat foods and generalized adoption of sedentary lifestyles. Furthermore, there is evidence that genes play an important role in the rise of obesity [2, 3]. Heritability is estimated to account for 40–90% of the population adiposity variation. Seemingly, the presence of single nucleotide polymorphisms (SNPs) offer a protective factor in the development of non-communicable diseases, such as obesity related diseases [4–6]. With the development of high-throughput genotyping techniques, new approaches such as genome-wide linkage and genome-wide association studies (GWAS) have been used to understand genetic influences in obesity [7]. However, the majority of identified SNPs have unknown biological functions and some of these studies yielded contradictory results, suggesting a need for further examination into the functions of identified SNPs related to obesity.
Fat mass and obesity-associated (FTO) variant rs9939609 was the first [8] locus to be positively associated with obesity-related phenotypes [8–12]. FTO is highly expressed in the hypothalamus and liver, appears to function in the central nervous system, and may have a role in energy balance, food intake regulation, and adipogenesis [13, 14]. There may be cross-talk between the FTO protein and leptin, an adipose-derived cytokine implicated in food intake regulation, energy and glucose homeostasis, lipid metabolism, and reproductive function [15]. The influence of leptin on body weight control is mediated by binding to the long isoform of its receptor (LEPR-b), which stimulates gene transcription by activating cytosolic signal transducer and transcription (STAT) proteins [15]. Recent evidence suggests that the LEPR-b-STAT3 signaling pathway may be involved in FTO regulation by restricting energy in the hypothalamus [16] and there is evidence that the leptin receptor (LEPR) variant rs1137101 is positively associated with obesity [17–19].
Leptin acts with hypothalamic receptors to induce satiety by inhibiting the orexigenic neuropeptide Y (NPY)/agouti-related peptide (AgRP) neuronal activity and stimulating the anorexigenic proopiomelanocortin (POMC)/amphetamine-related transcript (CART) neurons [20]. POMC is cleaved into melancortins and is processed to form the α-melanocyte hormone, which exerts catabolic activity via melanocortin-4 receptors (MC4R) to generate a feeling of fullness to suppress appetite [20]. MC4R is a G-protein-linked receptor widely expressed in the hypothalamus and central nervous system, implicated in energy homeostasis and glucose and lipid metabolism [21]. The MC4R variant rs17782313 was the second gene that was positively associated with common obesity traits [22–25]. By contrast, the MC4R variant rs2229616 is negatively associated with obesity [26, 27].
Peroxisome proliferator−activated receptor-gamma (PPARG) is another gene that has an important role in obesity. PPARG is a member of the nuclear hormone superfamily, which is involved in adipocyte differentiation and glucose metabolism [28]. There are evidences that PPARG deficiency results in increased leptin levels [28]. The PPARG rs1801282 variant is positively associated with obesity and has been extensively examined in epidemiological studies [29].
The aim of the present study was to assess the independent contributions of LEPR (rs1137101), FTO (rs9939609), MC4R (rs2229616 and rs17782313), and PPARG-2 (rs1801282) polymorphisms for clinically overweight or obesity phenotypes and endocrine-metabolic traits in prepubertal children.
Methods
Study design and participants
This descriptive cross-sectional study was part of a larger project (Nutritional, Biochemical, and Genetic Study of an Overweight and Obese Child Population in the Southern Region) approved by the Directorate General of Health, the Ministry of Science and Education of Portugal and by the Ethics Committee of the Hospital Garcia de Orta, according to the principles of Helsinki Declaration. The project was conductd from January 2009 to June 2013 in a population of prepubertal children (based on Tanner stage) recruited from 87 public schools in Lisbon and the Tagus Valley metropolitan region. Initially, 5989 subjects were initially recruited based on the assessment of anthropometric measurements, bioelectrical impedance, biochemical and genetic analysis.
To be included in the study, children should have completed nine years old during the ongoing school year, an inclusion criterion that reduced the initial population to 5577 children. The exact chronological age in days was calculated as the date of examination minus the date of birth. Children who transferred to another school prior to completing the minimum required measurements were excluded, further reducing the population to 5514 eligible children. Children whose parent did not provide written informed consent consent or withdrew consent for venous blood sampling, and those who self-reported as not fasting at the time of blood collection were excluded from the study, further reducing the sample size to 1496 children. For polymorphism analysis, 773 children were enrolled (Fig. 1). To address the possibility of self-selection bias, we compared anthropometric and biochemical data between selected and non-selected participants. No significant differences were found (data not shown).
Fig. 1.
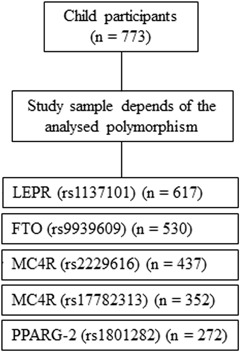
Flowchart of subject participation according to the selected polymorphism
Anthropometric and bioelectrical impedance analysis
Clinical assessments were performed in the schools under the supervision of two pediatric consultants. All anthropometric measurements (weight, height, BMI, BMI z-score (zBMI), waist circumference (WC), hip circumference (HC), waist-hip ratio (WHR), waist-circumference-to-height ratio (WHtR), mid-upper arm circumference (MUAC), calf circumference (CC), percent body fat (%BF), percent skeletal muscle (%SM), and resting metabolic rate (RMR)) were obtained from barefoot participants dressed with lightweight clothing using methods described previously [30]. zBMI was determined using the least mean squares method [30]. Children were categorized as normal weight (control group) or overweight/obese (case group) per the World Obesity/Policy and Prevention standards [formerly International Obesity Task Force (IOTF)] [31].
Biochemical analysis
Participants were instructed to fast for 12 hours before venipuncture for blood sampling in the morning at school. Blood samples were refrigerated at approximately 5 °C until transferred to our center immediately processed for serum separation, frozen at −80 °C on the same day, and stored until further analysis. The following serum biochemical parameters were assessed: total cholesterol (TC), high-density lipoprotein (HDL-c), low-density lipoprotein (LDL-c), triglycerides (TG), apolipoproteins A1 (Apo 1) and B (Apo B), glucose, creatinine, total proteins, ferritin, serum insulin and leptin. The homeostasis model assessment of insulin resistance (Homa-IR) was calculated from glucose (mg/dl) and insulin (µU/ml) using the following formula: Homa-IR = (insulin (µU/ml) × glucose (mg/dl))/405. All assessments were made using methods previously described [Furtado JM, Almeida SM, Mascarenhas, P, et al. Anthropometric features as predictors of atherogenic dyslipidemia and cardiovascular risk in a large population of school-aged children. (Under review)].
Genotyping
Genomic DNA was extracted from a whole peripheral blood sample using the MagNA Pure Compact Nucleic Acid Isolation Kit (Roche Diagnosis, 03730964001) and the MagNA Pure Compact Instrument (Roche Diagnostics GmbH, Germany) per the manufacturer’s instructions. DNA samples were stored at −20 °C until use. Real-time polymerase chain reaction (PCR)was performed in 96-well plates on an automated LightCycler 480 Real-Time PCR System (Roche Diagnostics, Vienna, Austria) using LightCycler FastStart DNA Master Hybprobe (Roche Diagnostics, Berlin, Germany) and LightSNPs (rs1137101 LEPR, rs9939609 FTO, rs2229616 and rs17782313 MC4R, and rs1801282 PPARG-2; TIB Molbiol Synthese labor, Berlin, Germany). The initial step for the allelic discrimination genotyping assay protocol included preincubation at 95 °C for 4 min, followed by 45 cycles of denaturation at 95 °C for 15 s, and annealing, extension, and detection for 40 s at 60 °C. To assess genotyping reproducibility, 10% of the sample was double-genotyped for all SNPs. Concordance rates >99% were obtained for the five tested SNPs. For negative control, Sterile PCR-grade H2O was used for the negative control.
Statistical analysis
SPSS Statistics (IBM, version 24, Armonk, NY, USA) was used for all statistical test procedures. Unless otherwise indicated, variables in tables are means ± standard deviations. Multiple comparisons were made by pairwise t-tests with Dunn-Bonferroni adjustment. Pearson’s chi-square statistic was utilized to examine allele/genotype distribution differences across categories and to test for Hardy-Weinberg equilibrium. Phenotype mean differences for each SNP genotype were obtained against the homozygous wild type genotype. Genotype and allele effects on BMI (kg/m2) and zBMI for each SNP were calculated according to their formulae as described in Falconer [32]. Major allele dominance type was evaluated using the relationship between dominance and additive effects. Effect size for polymorphic allele on zBMI was graded according to the following cutoffs: very weak effect (|x|<0.05), weak effect (0.05<|x|<0.2), medium effect (0.8>|x|>0.2), and strong effect (|x|>0.8). A two-sided P < 0.05 determined the significance level for statistical analysis.
Results
A final sample of 773 Portuguese school children (381 boys and 392 girls) with a mean age of 9.81 years were characterized according to clinical and biochemical parameters. Significant gender-related differences were observed; relative to the values in girls, boys were significantly taller and presented higher mean values of %SM, RMR, HDL-c, Apo A1, glucose, and creatinine, and lower mean values of %BF, LDL-c, TG, Apo B, TC/HDL, LDL/HDL, Apo B/Apo A1, TP, and leptin (P < 0.05) (Tables 1 and 2).
Table 1.
Descriptive clinical characteristics of the study population
| Overall | Gender | IOTF categorya | |||
|---|---|---|---|---|---|
| Male | Female | Normal weight | Overweight/obese | ||
| Characteristic | Mean ± SD | Mean ± SD | Mean ± SD | Mean ± SD | Mean ± SD |
| Ageb, e | 9.81 ± 0.59 | 9.81 ± 0.61a | 9.80 ± 0.57a | 9.81 ± 0.60c | 9.76 ± 0.59c |
| Anthropometry | |||||
| Weight (kg)e | 35.60 ± 8.77 | 35.91 ± 8.50a | 35.29 ± 9.02a | 31.37 ± 4.95c | 45.39 ± 7.80d |
| Height (cm)e | 138.2 ± 7.2 | 138.7 ± 6.8a | 137.7 ± 7.4b | 136.9 ± 7.1c | 141.3 ± 6.2d |
| BMI (kg/m2)e | 18.46 ± 3.37 | 18.50 ± 3.30a | 18.42 ± 3.44a | 16.66 ± 1.60c | 22.61 ± 2.66d |
| zBMIe | 0.65 ± 1.11 | 0.69 ± 1.07a | 0.60 ± 1.14a | 0.08 ± 0.76c | 1.97 ± 0.47d |
| WC (cm)f | 65.7 ± 9.68 | 65.4 ± 9.3a | 66.0 ± 10.0a | 61.2 ± 5.5c | 76.6 ± 9.0d |
| HC (cm)g | 71.0 ± 7.9 | 71.0 ± 7.8a | 71.0 ± 8.0a | 67.4 ± 5.2c | 80.0 ± 5.9d |
| WHR (WC/HC) | 0.89 ± 0.05 | 0.90 ± 0.05a | 0.89 ± 0.05a | 0.89 ± 0.05c | 0.92 ± 0.06d |
| WHtR (WC/height) | 0.48 ± 0.06 | 0.47 ± 0.06a | 0.48 ± 0.06a | 0.45 ± 0.35c | 0.54 ± 0.06d |
| MUAC (cm)f | 21.3 ± 3.1 | 21.3 ± 3.2a | 21.3 ± 3.0a | 19.9 ± 1.9c | 24.8 ± 2.5d |
| CC (cm)f | 29.3 ± 3.6 | 29.4 ±3 .5a | 29.2 ± 3.7a | 27.8 ± 2.6c | 32.9 ± 3.1d |
| Bioelectrical impedance | |||||
| BF (%)f | 21.89 ± 7.96 | 21.15 ± 7.36a | 22.63 ± 8.46b | 17.97 ± 5.12c | 31.16 ± 5.17d |
| SM (%)f | 31.87 ± 2.85 | 32.51 ± 2.78a | 31.25 ± 2.79b | 32.18 ± 2.99c | 31.15 ± 2.39d |
| RMR (Kcal/day)f | 1209 ± 114 | 1235 ± 120a | 1184 ± 103b | 1169 ± 90c | 1303 ± 13d |
Bold values highlights the statistically significant differences between groups
aAccording to World Obesity/Policy and Prevention cut-offs
bAge in days presented here as age in years. Distributions (mean ranks) vary between groups with different letters: subscript a, subscript b (P < 0.05)
cDistributions (mean ranks) and medians are the same between groups (P > 0.05)
dDistributions are different between groups (P < 0.05). Test of significance adjustment was performed using the Dun–Bonferroni correction
en = 773, 381, 392, 540, and 233 for overall, M, F, normal weight and overweight/obese
fn = 661, 329, 332, 468, and 197 for overall, M, F, normal weight and overweight/obese
gn = 392, 195, 199, 278, and 116 for overall, M, F, normal weight and overweight/obese
BF body fat, BMI body mass index, CC calf circumference, F female, HC hip circumference, M male, MUAC mid-upper arm circumference, RMR resting metabolic rate, SM skeletal muscle, WC waist circumference, WHR waist-hip ratio, WHtR waist- circumference-to-height ratio, zBMI BMI z-score
Table 2.
Descriptive biochemical characteristics of the study population
| Overall | Gender | IOTF categorya | |||
|---|---|---|---|---|---|
| (n = 625) | Male (n = 306) | Female (n = 319) | Normal weight (n = 425) | Overweight/Obese (n = 200) | |
| Characteristic | Mean ± SD | Mean ± SD | Mean ± SD | Mean ± SD | Mean ± SD |
| TC (mg/dl) | 170.1 ± 31.0 | 169.0 ± 30.2a | 171.2 ± 31.8a | 169.8 ± 30.3c | 171.7 ± 33.2c |
| LDL-c (mg/dl) | 90.1 ± 24.4 | 87.3 ± 23.1a | 92.7 ± 25.3b | 88.0 ± 23.5c | 95.4 ± 25.9d |
| HDL-c (mg/dl) | 55.5 ± 11.2 | 56.5 ± 11.3a | 54.6 ± 10.9b | 57.3 ± 11.5c | 51.4 ± 9.5d |
| TG (mg/dl) | 61.2 ± 27.1 | 58.2 ± 27.0a | 64.2 ± 26.9b | 55.7 ± 21.1c | 73.6 ± 34.2d |
| Apo A1 (g/L) | 1.35 ± 0.18 | 1.37 ± 0.18a | 1.33 ± 0.17b | 1.37 ± 0.18c | 1.30 ± 0.16d |
| Apo B (g/L) | 0.73 ± 0.18 | 0.70 ± 0.17a | 0.76 ± 0.18b | 0.71 ± 0.17c | 0.77 ± 0.19d |
| TC/HDL | 3.14 ± 0.67 | 3.07 ± 0.65a | 3.21 ± 0.68b | 3.03 ± 0.61c | 3.40 ± 0.73d |
| LDL/HDL | 1.68 ± 0.55 | 1.61 ± 0.53a | 1.75 ± 0.56b | 1.59 ± 0.52c | 1.90 ± 0.56d |
| Apo B/Apo A1 | 0.5 ± 0.1 | 0.5 ± 0.1a | 0.6 ± 0.2b | 0.5 ± 0.1c | 0.6 ± 0.2d |
| LDL/Apo B | 1.23 ± 0.16 | 1.24 ± 0.17a | 1.23 ± 0.15a | 1.23 ± 0.17c | 1.24 ± 0.14c |
| Glucose (mg/dl) | 78.5 ± 10.7 | 80.2 ± 11.2a | 76.8 ± 9.9b | 77.7 ± 10.5c | 79.8 ± 11.1d |
| Creatinine (mg/dl) | 0.60 ± 0.10 | 0.61 ± 0.09a | 0.59 ± 0.11b | 0.59 ± 0.10c | 0.60 ± 0.11c |
| TP (mg/dl) | 7.43 ± 0.75 | 7.33 ± 0.72a | 7.52 ± 0.76b | 7.36 ± 0.70c | 7.57 ± 0.84d |
| Ferritin (ng/ml) | 37.95 ± 21.32 | 36.72 ± 16.83a | 39.12 ± 24.86a | 37.29 ± 21.47c | 40.29 ± 21.29c |
| Leptin (ng/ml)e | 10.08 ± 11.12 | 7.71 ± 9.17a | 12.30 ± 12.30b | 5.27 ± 6.32c | 18.99 ± 12.57d |
| Insulin (µU/ml)e | 6.88 ± 9.58 | 6.74 ± 12.58a | 7.01 ± 5.48a | 5.29 ± 4.36c | 9.84 ± 14.69d |
| Homa-IR | 1.29 ± 1.20 | 1.17 ± 1.10a | 1.40 ± 1.29a | 1.04 ± 0.88c | 1.78 ± 1.56d |
Bold values highlights the statistically significant differences between groups
aAccording to World Obesity/Policy and Prevention
bAge in days was converted into age in years to compare groups. Distributions (mean ranks) vary between groups with different letters: subscript a, subscript b (P < 0.05)
cDistributions (mean ranks) and medians are the same between groups (P > 0.05)
dDistributions are different between groups (P < 0.05). Test of significance adjustment was performed using the Dunn-Bonferroni correction
en = 330, 160, 170, 211, 119 for overall, male, female, normal weight, overweight/obese, respectively
Apo A1 apolipoprotein A1, Apo B apolipoprotein B, HDL-c high-density lipoprotein cholesterol, LDL-c low-density lipoprotein cholesterol, TC total cholesterol, TG triglycerides, TP total proteins
Study subjects were stratified by zBMI according to the IOTF category as normal weight (69.9%, n = 540) or overweight/obese (30.1%, n = 233). Several clinical and biochemical features became progressively poorer as BMI increased, with overweight/obese children presenting significantly higher anthropometric, bioimpedance (except for %SM), and biochemical parameters (except for TC, LDL/Apo B, creatinine, and ferritin) (P < 0.05) (Tables 1 and 2).
Four genes were genotyped, with three genotypes identified for each gene, namely: LEPR (AA, AG, GG); FTO (TT, AT, AA); MC4R [GG, GA, AA (rs2229616), TT, TC, CC (rs17782313)]; and PPARG-2 (CC, CG, GG). The three genotypes correspond to homozygous wild type, heterozygous, and homozygous polymorphic, respectively.
The frequencies of wild type (major) and polymorphic (minor) alleles and the genotypes for overweight/obese and normal weight children are presented in Table 3. No statistical differences were found in allele/genotype frequencies between overweight/obese (case) and normal weight (control) subjects for all polymorphisms (P > 0.05). The absence of a positive association was extensive, even when the polymorphism effect was analyzed by gender (Table S1) (P > 0.05). Genotype frequencies in both overweight/obese and normal weight were in accordance with Hardy–Weinberg equilibrium, except for the LEPR polymorphism in the control group (P = 0.0058) (Table 3).
Table 3.
Allele and genotype frequencies of genetic variant polymorphisms in all subjects, overweight/obese subjects, and normal weight control subjects
| Gene | SNP | Allele | P | Genotype | Hardy–Weinberg equilibrium test | |||
|---|---|---|---|---|---|---|---|---|
| LEPR | rs11371101 | A | G* | AA | AG | GG | ||
| Overall | 653 (0.53) | 581 (0.47) | 190 (0.31) | 273 (0.44) | 154 (0.25) | 0.006 ** | ||
| Overweight/obese | 190 (0.56) | 152 (0.44) | 0.189 | 52 (0.3) | 86 (0.5) | 33 (0.19) | 0.88 | |
| Normal weight | 395 (0.51) | 375 (0.49) | 115 (0.3) | 165 (0.43) | 105 (0.27) | 0.0058 ** | ||
| FTO | rs9939609 | T | A* | TT | AT | AA | ||
| Overall | 557 (0.44) | 483 (0.46) | 159 (0.3) | 259 (0.49) | 112 (0.21) | 0.73 | ||
| Overweight/obese | 183 (0.55) | 151 (0.45) | 0.752 | 86 (0.3) | 137 (0.47) | 68 (0.23) | 0.88 | |
| Normal weight | 346 (0.54) | 298 (0.46) | 93 (0.29) | 160 (0.5) | 69 (0.21) | 1.00 | ||
| MC4R | rs2229616 | G | A* | GG | GA | AA | ||
| Overall | 865 (0.99) | 9 (0.01) | 428 (0.98) | 9 (0.02) | 0 (0.00) | 1.00 | ||
| Overweight/obese | 242 (0.99) | 2 (0.01) | 0.600 | 120 (0.98) | 2 (0.02) | 0 (0.00) | 1.00 | |
| Normal weight | 557 (0.99) | 7 (0.01) | 275 (0.98) | 7 (0.02) | 0 (0.00) | 1.00 | ||
| MC4R | rs17782313 | T | C* | TT | TC | CC | ||
| Overall | 554 (0.79) | 150 (0.21) | 222 (0.63) | 110 (0.31) | 20 (0.06) | 0.2 | ||
| Overweight/obese | 186 (0.82) | 42 (0.18) | 0.261 | 76 (0.67) | 34 (0.3) | 4 (0.04) | 1.00 | |
| Normal weight | 330 (0.78) | 94 (0.22) | 132 (0.62) | 66 (0.31) | 14 (0.07) | 0.16 | ||
| PPARG-2 | rs1801282 | C | G* | CC | CG | GG | ||
| Overall | 495 (0.91) | 44 (0.09) | 225 (0.83) | 45 (0.17) | 2 (0.01) | 1.00 | ||
| Overweight/obese | 131 (0.9) | 15 (0.1) | 0.539 | 58 (0.79) | 15 (0.21) | 0 (0.00) | 1.00 | |
| Normal weight | 342 (0.91) | 32 (0.09) | 157 (0.84) | 28 (0.15) | 2 (0.01) | 0.63 |
Bold values highlights the statistically significant differences between groups
CI confidence interval
*Polymorphic allele
**P < 0.05
The mean contribution of different genotypes of each polymorphism (mean (mean 95% CI)) were analyzed for the observed BMI, zBMI, %BF, and biochemical parameters. LEPR rs1137110 was associated with significantly lower BMI (−0.89 (−1.68, −0.09)) and zBMI (−0.24 (−0.50, 0.01)) in the GG genotype, and higher zBMI (0.13 (−0.09, 0.35)) in the heterozygous genotype (Table S2A). The FTO rs9939609 AG genotype was associated with significantly lower TC (−9.35 (−16.44,−2.25)), and the PPARG-2 rs1801282 GG genotype was associated with lower zBMI (−0.24 (−0.50, 0.01)) (Tables S2A and S2B). No other traits were associated with any statistical differences (P > 0.05) (Tables S2A and S2B).
To indirectly account for the childhood obesity propensity of each SNP, association analyses between the selected SNPs and zBMI/BMI were conducted (Table 4). Additive effects (half of the divergence between major and minor allele, homozygous outcome) of each selected SNP on zBMI resulted in the homozygous alleles for these selected SNPs were, on average +0.12 (FTO rs9939609), +0.34 (MC4R rs17782313), −0.30 (LEPR rs1137101) and −2.24 (PPARG rs1801282) zBMI units different than major allele homozygous. Conversely, the dominant effects of all SNPs for zBMI are in the opposite direction of the additive ones, reflecting a recessive zBMI inheritance pattern for these SNPs. LEPR rs11371101 and PPARG-2 rs1801282, on average, reduced zBMI / BMI (kg/m2) by −0.09/−0.25 and −0.15/−0.21, respectively, with an average decreasing effect of change to minor allele (AECME) of −0.48 and −2.34 kg/m2 on BMI, and −0.17 and −1.68 on zBMI, respectively. By contrast, FTO rs9939609 allele contributed, on average, an increase in our sample BMI by +0.06 kg/m2 and zBMI by +0.03, with an increase in AECME of +0.12 kg/m2 and +0.06 for BMI and zBMI, respectively. The MC4R rs17782313 allele, on average, reduced BMI by −0.12 kg/m2, with a decrease in AECME of −0.57 kg/m2 on BMI, and accounted for an increase in effect of +0.06 zBMI units with an associated increase in zBMI AECME of +0.26. In general, LEPR and PPARG-2 polymorphisms had weak and medium negative (decreasing) effects on zBMI, respectively, whereas FTO rs9939609 and MC4R rs17782313 had very weak and weak positive (increasing) effects, respectively. However, the effect of PPARG-2 polymorphism was determined by screening only two polymorphic homozygous for zBMI / BMI (kg/m2), due to the low relative frequency of the PPARG-2 polymorphic allele in the study population (9%). LEPR and PPARG-2 major alleles (wild type) showed overdominance and partial dominance for zBMI,while the major alleles showed complete dominance for zBMI outcome in FTO rs9939609 and MC4R rs17782313 (Table 4).
Table 4.
Effects of polymorphisms on BMI and zBMI
| Polymorphism | ||||
|---|---|---|---|---|
| LEPR rs11371101 | FTO rs9939609 | MC4R rs17782313 | PPARG-2 rs1801282 | |
| BMI (kg/m2) | ||||
| Dominant effect | 0.52 | −0.01 | 0.05 | 1.45 |
| Additive effect | −0.43 | 0.12 | −0.54 | −1.15 |
| Population mean | 18.56 | 18.7 | 18.37 | 18.3 |
| Minor allele average effect | −0.25 | 0.06 | −0.12 | −0.21 |
| Average effect of changing to minor allele | −0.48 | 0.12 | −0.57 | −2.34 |
| zBMI | ||||
| Dominant effect | 0.28 | −0.07 | −0.16 | 0.68 |
| Additive effect | −0.15 | 0.06 | 0.17 | −1.12 |
| Population mean | 0.81 | 1.27 | 1.63 | 1.24 |
| Minor allele average effect | −0.09 | 0.03 | 0.06 | −0.15 |
| Average effect of changing to minor allele | −0.17 | 0.06 | 0.26 | −1.68 |
| Major allele Dominance type on zBMI | Overdominance | Complete dominance | Complete dominance | Partial dominance |
| SNP effect size on population zBMI | Weak decrease | Very weak increase | Weak increase | Medium decrease* |
Bold values highlights the statistically significant differences between groups
BMI body mass index, zBMI BMI z-score
*Based on two minor homozygous alleles
We performed an association analysis of anthropometric traits, %BF, and biochemical parameters (dependent variables) on the three different genotypes (independent variable) of the selected genes using zBMI case-control groups (Tables 5 and 6). Significant differences were detected between anthropometric parameters and %BF in the LEPR polymorphism, where homozygous polymorphic normal weight children had significantly lower %BF than wild type homozygous and heterozygous (P < 0.05) (Table 5). Significant associations were observed for the MC4R rs17782313 CC genotypes in the overweight/obese group, with significantly higher mean scores for weight, zBMI, WC, WHR, and WHtR, and significantly lower mean scores for BMI, MUAC, CC, and %BF (P < 0.05) (Table 5). Higher mean scores in anthropometric parameters (height, BMI, zBMI, WC, HC, WHR, WHtR, MUAC, and CC) and %BF were also found for the FTO rs9939609 AA genotype in the overweight/obese group, whereas lower mean values of BMI, zBMI WC, WHtR, and %BF were observed for the LEPR rs1137110 GG genotype; however, these differences were not statistically significant (P > 0.05).
Table 5.
Comparisons of anthropometric parameters and %BF among all three genotypes in overweight/obese and normal weight subjects
| Gene | SNP | Genotype 1;2,3(n;n;n) | Weight1 (kg) | Height1 (cm) | BMI1 (kg/m2) | zBMI1 | WC2 (cm) | HC3 (cm) | WHR (WC/HC) | WHtR (WC/height) | MUAC2 (cm) | CC2 (cm) | BF2 (%) |
|---|---|---|---|---|---|---|---|---|---|---|---|---|---|
| LEPR | rs11371101 | ||||||||||||
| Overweight/obese | AA (76;64;36) | 47.2 ± 9.1a | 141.4 ± 6.2a | 23.29 ± 2.52a | 2.11 ± 0.47a | 78.34 ± 8.94a | 82.4 ± 4.8a | 0.93 ± 0.07a | 0.557 ± 0.058a | 24.8 ± 2.3a | 33.3 ± 2.6a | 32.45 ± 4.58a | |
| AG (127;102;65) | 46.2 ± 7.9a | 142.1 ± 6.5a | 23.58 ± 2.73a | 2.14 ± 0.47a | 79.44 ± 9.16a | 82.5±7.4a | 0.93±0.05a | 0.559 ± 0.055a | 25.4 ± 2.5a | 34.0 ± 3.4a | 32.76 ± 5.80a | ||
| GG (50;40;24) | 45.8 ± 7.4a | 143.1 ± 5.3a | 23.18 ± 2.29a | 2.07 ± 0.47a | 70.09 ± 7.24a | 84.0 ± 7.1a | 0.94 ± 0.08a | 0.552 ± 0.047a | 25.6 ± 2.0a | 33.7 ± 2.8a | 31.15 ± 5.09a | ||
| Normal weight | AA (107;74;16) | 31.9 ± 5.1a | 137.6 ± 7.2a | 16.95 ± 1.66a | 0.15 ± 0.78a | 63.67 ± 5.76a | 67.8 ± 7.0a | 0.92 ± 0.04a | 0.464 ± 0.033a | 20.2 ± 1.8a | 28.3 ± 2.3a | 18.43 ± 4.58a | |
| AG (138;121;32) | 31.8 ± 5.1a | 138.1 ± 7.7a | 16.89 ± 1.62a | 0.13 ± 0.76a | 63.45 ± 5.87a | 67.1 ± 6.0a | 0.90 ± 0.04a | 0.460 ± 0.037a | 20.3 ± 1.9a | 28.4 ± 2.4a | 18.20 ± 5.26a | ||
| GG (99;84;16) | 31.3 ± 5.0a | 138.0 ± 7.7a | 16.59 ± 1.81a | -0.05 ± 0.87a | 62.02 ± 5.85a | 66.6 ± 6.1a | 0.90 ± 0.03a | 0.451 ± 0.040a | 20.1 ± 2.2a | 28.1 ± 2.4a | 16.89 ± 5.65b | ||
| FTO | rs9939609 | ||||||||||||
| Overweight/obese | TT (86;79;61) | 45.1 ± 6.9a | 141.3 ± 6.7a | 22.81 ± 2.25a | 2.05 ± 0.42a | 76.25 ± 8.10a | 80.5 ± 5.6a | 0.92 ± 0.06a | 0.541 ± 0.052a | 24.7 ± 2.5a | 32.9 ± 2.8a | 30.91 ± 5.31a | |
| AT (137;121;94) | 45.0 ± 7.8a | 141.4 ± 6.0a | 22.89 ± 2.74a | 2.04 ± 0.46a | 76.49 ± 8.94a | 80.9 ± 6.5a | 0.92 ± 0.06a | 0.542 ± 0.057a | 24.8 ± 2.2a | 32.9 ± 3.3a | 31.59 ± 5.44a | ||
| AA (68;59;46) | 46.3 ± 8.3a | 142.1 ± 6.4a | 23.24 ± 2.33a | 2.12 ± 0.40a | 77.35 ± 8.52a | 81.7 ± 5.7a | 0.93 ± 0.06a | 0.545 ± 0.051a | 25.1 ± 2.2a | 33.1 ± 3.1a | 31.59 ± 5.63a | ||
| Normal weight | TT (69;63;31) | 31.5 ± 5.2a | 138.0 ± 7.6a | 16.85 ± 1.54a | 0.16 ± 0.74a | 62.01 ± 5.11a | 69.7 ± 3.7a | 0.87 ± 0.04a | 0.451 ± 0.032a | 20.0 ± 1.8a | 28.0 ± 2.4a | 18.17 ± 5.32a | |
| AT (119;100;62) | 30.2 ± 4.9a | 137.4 ± 7.1a | 16.99 ± 1.49a | 0.24 ± 0.71a | 61.95 ± 5.67a | 68.7 ± 5.0a | 0.88 ± 0.05a | 0.452 ± 0.035a | 20.2 ± 1.7a | 28.1 ± 2.3a | 18.87 ± 4.87a | ||
| AA (42;42;15) | 31.8 ± 4.5a | 136.5 ± 7.8a | 16.56 ± 1.43a | 0.02 ± 0.72a | 61.03 ± 3.82a | 67.5 ± 3.5a | 0.88 ± 0.04a | 0.449 ± 0.033a | 19.8 ± 1.3a | 28.2 ± 1.7a | 18.00 ± 5.89a | ||
| MC4R | rs2229616 | ||||||||||||
| Overweight/obese | GG (226;204;166) | 46.1 ± 8.2a | 141.7 ± 6.2a | 23.40 ± 2.77a | 2.15 ± 0.46a | 77.7 ± 9.42a | 81.7 ± 6.0a | 0.92 ± 0.06a | 0.549 ± 0.060a | 25.1 ± 2.4a | 33.2 ± 3.3a | 31.90 ± 592a | |
| GA (5;5;3) | 52.1 ± 12.5a | 144.4 ± 8.1a | 24.05 ± 0.93a | 2.29 ± 0.19a | 80.4 ± 6.89a | 84.0 ± 1.7a | 0.94 ± 0.06a | 0.556 ± 0.018a | 25.9 ± 2.4a | 35.0 ± 1.4a | 32.92 ± 5.54a | ||
| AA (0;0;0) | |||||||||||||
| Normal weight | GG (199;173;84) | 30.9 ± 4.9a | 137.3 ± 7.2a | 16.59 ± 1.51a | 0.04 ± 0.73a | 61.3 ± 4.76a | 68.5 ± 4.3a | 0.88 ± 0.05a | 0.449 ± 0.031a | 19.7 ± 1.7a | 27.8 ± 2.1a | 17.68 ± 5.24a | |
| GA (4;4;4) | 33.5 ± 8.3a | 137.7 ± 9.6a | 16.25 ± 1.48a | -0.10 ± 0.70a | 60.3 ± 7.43a | 67.5 ± 1.3a | 0.84 ± 0.05a | 0.438 ± 0.027a | 19.3 ± 2.5a | 27.9 ± 2.8a | 16.80 ± 5.68a | ||
| AA (0;0;0) | |||||||||||||
| MC4R | rs17782313 | ||||||||||||
| Overweight/obese | TT (140;124;91) | 47.3 ± 8.0a,b | 142.6 ± 6.1a | 23.92 ± 2.75a | 2.22 ± 0.47a | 79.5 ± 9.07a | 83.3 ± 6.1a | 0.93 ± 0.07a | 0.559 ± 0.058a | 25.6 ± 2.4a | 34.0 ± 3.2a | 32.93 ± 5.51a | |
| TC (77;69;57) | 45.3 ± 6.8a | 141.6 ± 5.8a | 22.69 ± 2.11b | 2.03 ± 0.40b | 75.2 ± 7.98b | 80.3 ± 5.2b | 0.92 ± 0.06a | 0.532 ± 0.051b | 24.7 ± 2.0b | 32.4 ± 2.8b | 30.82 ± 4.91b | ||
| CC (15;15;11) | 57.4 ± 17.1b | 141.7 ± 7.1a | 23.89 ± 4.21a,b | 2.26 ± 0.50a,b | 80.6 ± 12.21a,b | 81.5 ± 5.6a,b | 0.94 ± 0.06a | 0.568 ± 0.074a,b | 25.2 ± 3.0a,b | 33.3 ± 3.4a,b | 31.35 ± 8.56a,b | ||
| Normal weight | TT (80;67;32) | 31.5 ± 5.1a | 137.3 ± 7.6a | 16.74 ± 1.37a | 0.13 ± 0.66a | 61.3 ± 4.76a | 68.1 ± 4.2a | 0.87 ± 0.05a | 0.448 ± 0.029a | 20.0 ± 1.5a | 28.0 ± 2.2a | 18.09 ± 5.06a | |
| TC (32;24;8) | 31.2 ± 4.9a | 137.0 ± 6.9a | 16.85 ± 1.77a | 0.11 ± 0.78a | 61.2 ± 5.53a | 70.4 ± 4.2a | 0.86 ± 0.06a | 0.450 ± 0.029a | 19.7 ± 1.9a | 27.6 ± 2.3a | 17.60 ± 5.80a | ||
| CC (4;4;1) | 29.8 ± 6.1a | 139.5 ± 9.8a | 16.55 ± 1.49a | 0.04 ± 0.76a | 64.6 ± 6.51a | 71.0a | 0.82a | 0.455 ± 0.012a | 20.8 ± 1.9a | 29.7 ± 2.1a | 20.23 ± 5.32a | ||
| PPAR- | rs1801282 | ||||||||||||
| 2 | Overweight/ obese | CC (64;64;64) | 43.2 ± 6.3a | 139.0 ± 6.1a | 22.04 ± 2.16a | 1.95 ± 0.41a | 72.70 ± 7.68a | 79.3 ± 6.2a | 0.92 ± 0.06a | 0.522 ± 0.051a | 23.9 ± 2.1a | 31.4 ± 2.6a | 29.96 ± 5.31a |
| CG (12;12;12) | 43.1 ± 7.3a | 140.9 ± 7.8a | 21.42 ± 1.18a | 1.79 ± 0.28a | 72.54 ± 4.87a | 79.5 ± 5.2a | 0.91 ± 0.04a | 0.515 ± 0.023a | 24.0 ± 1.3a | 31.7 ± 2.1a | 29.40 ± 3.69a | ||
| GG (0;0;0) | |||||||||||||
| Normal weight | CC (140;140;140) | 30.6 ± 4.9a | 136.8 ± 7.4a | 16.82 ± 1.55a | 0.23 ± 0.72a | 60.31 ± 4.29a | 68.8 ± 5.7a | 0.88 ± 0.05a | 0.442 ± 0.028a | 20.0 ± 1.9a | 27.6 ± 2.4a | 19.29 ± 5.70a | |
| CG (33;33;33) | 30.5 ± 4.3a | 135.3 ± 6.3a | 16.46 ± 1.58a | 0.02 ± 0.80a | 59.48 ± 4.17a | 67.4 ± 4.8a | 0.88 ± 0.04a | 0.440 ± 0.027a | 19.4 ± 1.9a | 27.0 ± 2.1a | 18.23 ± 5.20a | ||
| GG (2;2;2) | 27.2 ± 2.7a | 136.9 ± 14.0a | 17.87 ± 0.19a | 0.90 ± 0.00a | 63.00 ± 4.24a | 72.5 ± 3.5a | 0.87 ± 0.02a | 0.461 ± 0.016a | 21.5 ± 0.7a | 28.0 ± 2.8a | 22.75 ± 2.62a |
Bold values highlights the statistically significant differences between groups
Distributions (mean ranks) are different between groups with different letters: subscript a, subscript b (p < 0.05). Test of significance adjustments was performed using the Dunn–Bonferroni correction
aThis category was not used for comparisons because there was no other category to compare
BF body fat, BMI body mass index CC calf circumference, HC hip circumference, MUAC mid-upper arm circumference RMR resting metabolic rate, WC waist circumference, WHR waist–hip-ratio, WHtR waist circumference-to-height-ratio, zBMI BMI z-score
1,2,3(n;n;n) with n = number of children for each variable
Table 6.
Comparisons of biochemical parameters among all three genotypes in overweight/obese and normal weight subjects
| Gene | SNP | Genotype 1;2(n;n) | TC1 (mg/dl) | LDL-C1 (mg/dl) | HDL-C1 (mg/dl) | TG1 (mg/dl) | Apo A11 (g/L) | Apo B1 (g/L) | Leptin2 (mg/dl) | Glucose1 (mg/dl) | Insulin2 (µU/ml) | Homa-IR |
|---|---|---|---|---|---|---|---|---|---|---|---|---|
| LEPR | rs11371101 | |||||||||||
| Overweight/ obese | AA (73;42) | 172.9 ± 31.1a | 98.3 ± 24.2a | 50.9 ± 9.1a | 76.2 ± 36.3a | 1.31 ± 0.14a | 0.78 ± 0.17a | 22.13 ± 13.56a | 78.9 ± 10.9a | 8.66 ± 7.34a | 1.89 ± 1.79a | |
| AG (117;62) | 172.7 ± 31.4a | 96.8 ± 27.3a | 51.1 ± 8.8a | 77.6 ± 34.2a | 1.29±0.16a | 0.76 ± 0.20a | 19.86 ± 12.58a | 79.2 ± 11.3a | 8.98 ± 8.80a | 1.83 ± 2.03a | ||
| GG (46;23) | 170.3 ± 35.7a | 97.6 ± 27.1a | 50.5 ± 10.0a | 77.2 ± 32.6a | 1.30 ± 0.16a | 0.78 ± 0.21a | 18.79 ± 9.88a | 78.3 ± 12.5a | 18.41 ± 35.27a | 3.16 ± 7.42a | ||
| Normal weight | AA (102;64) | 166.2 ± 26.5a | 83.6 ± 19.4a | 56.1 ± 10.6a | 54.8 ± 20.2a | 1.37 ± 0.19a | 0.73 ± 0.16a | 5.19 ± 4.72a | 73.6 ± 10.3a | 5.51 ± 4.46a | 1.13 ± 1.05a | |
| AG (136;80) | 166.7 ± 31.2a | 85.3 ± 24.2a | 54.9 ± 10.4a | 56.0 ± 21.0a | 1.34 ± 0.16a | 0.70 ± 0.17a | 5.89 ± 6.53a | 76.5 ± 11.4a.b | 5.39 ± 4.75a | 0.97 ± 0.79a | ||
| GG (99;64) | 173.3 ± 36.9a | 88.5 ± 25.9a | 56.7 ± 12.7a | 58.8 ± 22.3a | 1.37 ± 0.22a | 0.73 ± 0.19a | 4.78 ± 4.42a | 78.7 ± 10.5b | 5.62 ± 3.28a | 1.11 ± 0.76a | ||
| FTO | rs9939609 | |||||||||||
| Overweight/ obese | TT (71;47) | 169.4 ± 33.5a | 94.4 ± 27.6a | 51.1 ± 9.5a | 86.3 ± 42.6a | 1.29 ± 0.15a | 0.75 ± 0.19a | 19.15 ± 10.36a | 79.5 ± 11.9a | 11.05 ± 18.57a | 2.86 ± 5.86a | |
| AT (121;74) | 172.9 ± 28.0a | 101.3 ± 24.6a | 51.5 ± 9.9a | 74.1 ± 32.0a.b | 1.30 ± 0.17a | 0.79 ± 0.17a | 18.09 ± 11.46a | 80.4 ± 11.6a | 8.10 ± 7.75a | 1.64 ± 1.75a | ||
| AA (65;37) | 172.9 ± 28.0a | 98.9 ± 29.1a | 51.5 ± 9.4a | 71.5 ± 27.4b | 1.31 ± 0.16a | 0.77 ± 0.21a | 19.14 ± 12.74a | 79.9 ± 10.1a | 11.04 ± 23.93a | 1.53 ± 1.45a | ||
| Normal weight | TT (69;33) | 172.4 ± 29.0a | 90.7 ± 26.3a | 58.6 ± 9.4a.b | 53.7 ± 21.7a | 1.40 ± 0.16a | 0.73 ± 0.18a | 5.63 ± 6.71a | 75.0 ± 11.0a | 5.47 ± 4.73a | 1.09 ± 0.93a | |
| AT (116;60) | 166.5 ± 30.0a | 86.6 ± 21.4a | 57.4 ± 10.8a | 55.0 ± 20.2a | 1.36 ± 0.18a | 0.70 ± 0.14a | 5.17 ± 5.17a | 76.9 ± 10.4a | 5.09 ± 3.25a | 0.96 ± 0.66a | ||
| AA (41;23) | 172.9 ± 33.3a | 83.7 ± 24.1a | 62.3 ± 14.5b | 51.9 ± 21.0a | 1.44 ± 0.20a | 0.70 ± 0.20a | 2.76 ± 1.56a | 78.7 ± 10.0a | 5.02 ± 4.87a | 1.05 ± 1.23a | ||
| MC4R | rs2229616 | |||||||||||
| Overweight/ obese | GG (190;137) | 170.5 ± 30.0a | 99.5 ± 26.6a | 50.6 ± 9.1a | 80.0 ± 35.1a | 1.29 ± 0.15a | 0.77 ± 0.18a | 19.521 ± 12.47 | 80.0 ± 10.5a | 9.68 ± 16.93a | 1.95 ± 3.52a | |
| GA (5;1) | 186.2 ± 31.1a | 112.6 ± 31.4a | 54.4 ± 12.0a | 79.4 ± 32.5a | 1.33 ± 0.23a | 0.83 ± 0.23a | 12.60b | 78.8 ± 3.3a | 4.00b | 1.26b | ||
| AA (0;0) | ||||||||||||
| Normal weight | GG (193;106) | 169.7 ± 30.3a | 86.9 ± 22.7a | 58.1 ± 11.5a | 55.2 ± 22.0a | 1.38 ± 0.19a | 0.71 ± 0.17a | 4.67±4.32a | 76.3 ± 10.3a | 5.34 ± 4.69a | 0.98 ± 0.88a | |
| GA (4;1) | 159.5 ± 27.7a | 87.5 ± 24.1a | 55.3 ± 10.3a | 51.0 ± 11.3a | 1.36 ± 0.13a | 0.70 ± 0.13a | 9.10b | 73.5 ± 3.9a | 3.60b | 0.69b | ||
| AA (0;0) | ||||||||||||
| MC4R | rs17782313 | |||||||||||
| Overweight/ obese | TT (125;76) | 170.1 ± 30.0a | 98.9 ± 27.0a | 50.0 ± 8.6a | 81.3 ± 35.8a | 1.28 ± 0.15a | 0.77 ± 0.18a | 21.27 ± 12.69a | 79.3 ± 11.0a | 11.72 ± 21.80a | 2.30 ± 4.50a | |
| TC (67;56) | 173.1 ± 27.0a | 99.5 ± 23.9a | 51.9 ± 10.2a | 77.3 ± 35.5a | 1.32 ± 0.17a | 0.77 ± 0.16a | 17.07 ± 10.06a | 80.8 ± 9.5a | 7.66 ± 6.71a | 1.64 ± 1.54a | ||
| CC (12;8) | 160.7 ± 34.5a | 91.9 ± 29.1a | 48.3 ± 8.2a | 73.2 ± 28.7a | 1.28 ± 0.16a | 0.70 ± 0.21a | 19.47 ± 22.67a | 81.1 ± 9.1a | 8.15 ± 10.36a | 1.72 ± 2.56a | ||
| Normal weight | TT (79;42) | 170.0 ± 32.8a | 86.4 ± 24.1a | 59.7 ± 12.0a | 53.1 ± 20.3a | 1.41 ± 0.19a | 0.70 ± 0.18a | 4.88 ± 6.20a | 77.3 ± 10.0a | 5.88 ± 5.37a | 1.18 ± 1.19a | |
| TC (31;16) | 173.7 ± 31.7a | 87.9 ± 24.4a | 56.6 ± 8.5a | 57.3 ± 17.6a | 1.39 ± 0.15a | 0.75 ± 0.19a | 6.27 ± 6.70a | 78.0 ± 10.1a | 5.38 ± 3.35a | 1.09 ± 0.77a | ||
| CC (4;2) | 169.9 ± 16.4a | 99.3 ± 11.3a | 47.0 ± 5.0a | 73.3 ± 35.8a | 1.27 ± 0.16a | 0.78 ± 0.08a | 6.13 ± 4.20a | 73.0 ± 10.0a | 3.03 ± 0.81a | 0.53 ± 0.23a | ||
| PPARG- | rs1801282 | |||||||||||
| 2 | Overweight/obese | CC (44;34) | 170.5 ± 36.0a | 102.9 ± 28.7a | 52.5 ± 10.6a | 75.1 ± 29.2a | 1.31 ± 0.19a | 0.78 ± 0.18a | 18.23 ± 11.64a | 85.8 ± 22.4a | 10.48 ± 12.89a | 2.70 ± 4.54a |
| CG (8;6) | 170.0 ± 21.8a | 102.9 ± 16.0a | 52.1 ± 6.4a | 61.5 ± 21.5a | 1.29 ± 0.18a | 0.77 ± 0.12a | 16.34 ± 2.67a | 79.1 ± 9.7a | 6.41 ± 3.75a | 1.48 ± 0.61a | ||
| GG (0;0) | ||||||||||||
| Normal weight | CC (101;35) | 170.8 ± 24.4a | 93.0 ± 21.4a | 60.5 ± 10.3a | 58.5 ± 22.3a | 1.39 ± 0.17a | 0.71 ± 0.13a | 7.42 ± 12.13a | 78.4 ± 10.2a | 3.70 ± 2.76a | 0.73 ± 0.48a | |
| CG (22;7) | 174.2 ± 26.2a | 96.7 ± 20.9a | 58.1 ± 8.0a | 58.2 ± 16.1a | 1.35 ± 0.14a | 0.75 ± 0.12a | 4.02 ± 2.65a | 77.0 ± 8.2a | 3.38 ± 2.08a | 0.67 ± 0.38a | ||
| GG (2;1) | 181.5 ± 68.6a | 96.0 ± 11.3a | 67.0 ± 35.4a | 54.0 ± 18.4a | 1.91a | 0.75 ± 0.06a | 9.47a | 80.5 ± 6.4a | 6.43a | 1.21a |
Bold values highlights the statistically significant differences between groups
Distributions (mean ranks) vary between groups with different letters: subscript a, subscript b (P < 0.05). Test of significance adjustments was performed using the Dunn-Bonferroni correction
aThis category was not used for comparisons because there was no other category to compare
bThis category was not used for comparisons because the sum of case ponderations was less than two
Apo A1 apolipoprotein A1, Apo B apolipoprotein B, HDL-c high-density lipoprotein cholesterol, LDL-c low-density lipoprotein cholesterol, TC total cholesterol, TG triglycerides
1,2(n;n) with n = number of children for each variable
Regarding the biochemical parameters, children with LEPR rs1137110 AG and GG genotypes in the normal weight group had significantly higher glucose levels than children with AA genotype (P < 0.05). Children with FTO rs9939609 AT and AA genotypes in the overweight/obese group had significantly lower TG levels (P < 0.05) (Table 6). For the same polymorphism, normal weight subjects with the AA genotype had significantly higher levels of HDL-c (P < 0.05) (Table 6).
Discussion
Ethnicity and environmental factors (i.e., modifying the gene expression but not it’s structure) may affect specific genetic variants under specific conditions, which may distinctly affect obesity-related phenotypes. Obesity can be associated with different metabolic phenotypes of atherogenic lipid profiles and insulin resistance and several studies have investigated the links between obesity, biochemical traits, and polymorphisms to establish possible mechanisms of action [29, 32–34]. This genetic information could be useful to identify children at risk, plan early interventions, and reduce the life-long burden of obesity-related diseases. However, most studies of obesity-SNP associations have yielded controversial results, and the mechanisms underlying the increased risk of obesity conferred by specific alleles remain unclear.
LEPR rs11371101
The LEPR rs11371101 variant is one of the most frequent LEPR gene polymorphisms and the most likely to have functional consequences [35]. Previous studies reported conflicting results with either positive [21–23] or no association [36] with obesity traits and metabolic parameters. For example, Pyrzaket et al. analyzed a cohort of 101 obese children (12−18 years old) and found that the LEPR gene variant was not associated with obesity, leptin, insulin resistance, or other metabolic abnormalities [36]. Similarly, Endo et al. verified that the LEPR Gln223Arg (rs11371101) polymorphism was not associated with obesity in 553 Japanese school children aged 9−15 years [37]. A meta-analysis of case-control studies and a systematic review also reported that there was no association between the LEPR gene polymorphism and obesity [35, 38]. By contrast, Shabana and Hasnain reported that the LEPR polymorphism was associated with weight, BMI, plasma glucose levels, TC, TG, HDL-c, and LDL-c, whereas it was not associated with WC, HC, and WHR in 475 Pakistani subjects (10–78 years) [39]. Our results show no statistical association between the LEPR polymorphism, anthropometric, and metabolic parameters in normal and overweight/obese children, potentially due to a recessive weak effect on zBMI despite his high frequency (47%) in the studied population.
FTO rs9939609
FTO functions have not yet been fully established. In an in vitro study, Wu et al. reported that FTO is a co-activator of the CCAAT enhancer-binding protein (C/EBP) family of transcriptional regulators, required in combination with PPARG for adipocyte differentiation, suggesting a role for FTO in the epigenetic regulation of adipose tissue development and maintenance [40]. Several studies reported a positive association between this polymorphism and BMI or other obesity traits in Caucasian populations [8, 10–12], including a study of a few anthropometric parameters by Albuquerque et al. in a cohort of 730 Portuguese children (6−12 years old) [9]. The frequency of the polymorphic allele described by Albuquerque et al. is within the range of our reported values, although the effect of the minor allele on BMI was higher (0.6 kg/m2) in the previous study. Studies in Oceanic [41], African [42], and Asian [43] populations found no association between the FTO variant and BMI. By contrast Wu et al. studied Han Chinese adolescents and reported that this FTO variant was positively associated with BMI and metabolic traits such as fasting glucose, insulin, TG, and TC [44]. Conversely, Li et al. found no association between this FTO variant and BMI, WC, %BF, fasting levels of plasma glucose, hemoglobin A1C, insulin, or β-cell function (estimated by homeostasis model assessment) in an adult Han Chinese population [43]. Mangee et al. also found no associations between this FTO variant and the previous biochemical parameters, HDL-c, oxidized LDL, insulin, Homa-IR, and leptin in Austrian (Styrian) adolescents [45]. Consistent with these results, the results of the current study suggest that this polymorphism has no effect, or eventually a recessive very weak increasing one, on zBMI, despite being present at a high frequency (46%) in the studied population.
MC4R rs2229616 and rs17782313
The MC4R variant is expressed in the central nervous system, and is part of the melanocortin pathway that controls food intake and energy homeostasis [21]. The most common coding MC4R polymorphism is MC4R rs2229616 (V103I missense variant) and it was the first described as showing no association with BMI, plasma insulin, and glucose levels in white British males [46]. Another study reported similar heterozygous frequencies in lean and obese individuals (4.2 vs. 4.5%, respectively), and found no homozygous frequencies for the polymorphic allele [26]. These results are consistent with our findings and indicate that the MC4R rs2229616 polymorphic allele is rare. By contrast, Geller et al. performed a meta-analysis of 7000 individuals and reported that the MC4R polymorphic allele was negatively associated with obesity [47], consistent with the results of other studies [26, 27]. A possible mechanism underlying the protective effect of the MC4R V103I polymorphism could be an increase in energy expenditure [47]. Consistent with others, our results indicate that the MC4R rs17782313 variant is positively associated with obesity traits in overweight/obese children [22–25]. This gene variant may facilitate obesity by increasing the intake of high-energy or fatty foods or promote overeating in response to emotional eating [48]. We did not identify any differences in biochemical parameters associated with different genotypes of this polymorphism.
García-Solis et al. studied 580 children (8−13 years old) and found that heterozygous subjects for this polymorphism risk allele were significantly associated with obesity but not with TC, HDL-c, or insulin levels [22]. Furthermore, Loos et al. confirmed that BMI in children (7−11 years old) was positively associated with each additional copy of the polymorphic allele, with a BMI increase of 0.10 kg/m2 and 0.13 z-score units (P < 7.3 × 10⁻⁶), twice of that observed in adults (P = 0.001) [23] and in agreement with the results of the present study (0.26 zBMI units increase for changing to minor allele). In our population, this recessive increasing effect polymorphism for zBMI yielded a weak effect size. The results from populations of African-American children remain controversial [49].
PPARG-2 rs1801282
PPARG isoforms 1 and 2 are transcription factors that activate adipocyte differentiation and mediate the expression of specific fat cell genes [28]. However, PPARG-2 rs1801282 may not be associated with obesity and type 2 diabetes mellitus [50]. Although we did not detect significant associations, the results showed a trend toward reduced mean BMI in heterozygous overweight/obese children than in homozygous wild type. Furthermore, our results also suggest the presence of a recessive medium decreasing effect on zBMI, although there was a low frequency (9%) of this minor allele in the studied population, which is a limitation to this finding. This is consistent with a study of 194 premenopausal Caucasian Portuguese females, which also found no significant differences in BMI between the control and case groups for this polymorphism [51]. However, a meta-analysis concluded that PPARG variants contributed to human adiposity variation and predisposition for obesity [29]. These inconsistencies may suggest that PPARG polymorphisms may be labeled differently in different ethnic populations, or that there are dissimilar gene-environment interactions.
Conclusion
We did not detect statistical associations between LEPR rs11371101, FTO rs9939609, MC4R rs2229616, and PPARG-2 rs1801282 polymorphisms and most obesity-related phenotypes and metabolic parameters. Possible explanations could be low statistical power, low carrier frequency, or moderate sample size for some variants. Age differences and genetic environment background could also explain the effect of genes influence in a trait at different developmental stages or the same genes may have a larger impact on a trait as it develops. A longitudinal study may potentially disclose this point, allowing an exploration of the life course genetic associations with clinical and biochemical parameters. Despite these limitations, our data identifies the BMI and zBMI effects of genetic traits that are likely related to obesity, although with modest impact in younger ages, which is in agreement with other authors [9, 23]. This study demonstrates that it is possible to detect and measure the influence of genetic variants on clinical and metabolic characteristics in childhood, reinforcing the concept that there is an important interaction between genes and environment (even if the role of environmental cues may not have much impact in such younger ages) in the development of excessive weight gain and its related complications.
The current study also collected data of weight and height since child birth (Personal Child Health Record) until 9 years of age, which allowed us to determine the adiposity rebound (AR) [52] and permitted us to conclude that over 50% of children (data not shown) had an AR prior to the age of 6 years, suggesting that negative environmental factors (e.g., nutritional) are already present in early ages which may explain the high rate of overweight/obesity in our population. Another strength of this study is the characterization of five gene SNPs that were cross-matched with an extensive panel of anthropometric and biochemical parameters. To our knowledge this is the first study trying to establish an association between clinical, metabolic phenotypes and LEPR rs11371101, MC4R rs2229616 and rs17782313 and PPARG-2 rs1801282 in Portuguese children and the first association between biochemical parameters dependent from obesity and FTO rs9939609 in the same population.
Finally, this study showed that MC4R rs17782313 and FTO rs9939609 were positively associated with zBMI, with weak and very weak effects, respectively, suggesting a very scarce contribution to childhood obesity at this age. LEPR rs1137101 and PPARG-2 rs1801282 had weak and medium negative effects on zBMI, respectively, and may slightly protect against childhood obesity. Considering that, in our prepubertal children, the impact on obesity of the SNPs of the genes included in this study is very modest, so we think that, at this age, a clinical application is not justified. Therefore we recommend further research on this topic, with longitudinal design studies or cross-sectional studies including children at a more advanced stage of development taking in account the impact of environmental factors (specially nutritional and physical activity).
Electronic supplementary material
Acknowledgements
The authors thank the children, parents, and teachers at the participating schools, João Vintém, and Solange Campos for managing the program.
Funding
This work was funded by The Directorate General of Health, Ministry of Health, and, in part, by Egas Moniz Higher Education Cooperative (Martins dos Santos). An informatics platform was funded by Rui Nabeiro (Nabeiro Group).
Author contributions
J.M.F., S.A., and F.F. designed the study; S.A., F.P.F., and M.E.F. conducted anthropometric and BIA measurements; P.M. performed statistical analysis; J.M.F. and S.A. wrote the manuscript under the guidance of FPF; and J.C.F., M.P.M., and M.V. critically reviewed the preliminary draft of this manuscript. All authors read and approved the final manuscript. This manuscript was edited by BioMed Proofreading.
Compliance with ethical standards
Conflict of interest
The authors declare that they have no conflict of interest.
Ethical approval
All procedures performed in studies involving human participants were in accordance with the ethical standards of the Directorate General of Health, the Ministry of Science and Education of Portugal, and by the Ethics Committee of the Hospital Garcia de Orta and with the the 1964 Helsinki Declaration and its later amendments or comparable ethical standards. Ethical Committee Approval Nº 73 (30/09/2008).
Informed consent
Informed consent was obtained from all individual participants included in the study.
Footnotes
Electronic supplementary material
The online version of this article (10.1007/s12020-018-1587-3) contains supplementary material, which is available to authorized users.
References
- 1.Comission on Ending Childhood Obesity. Facts and figures on childhood obesity. World Health Orgnization (Fact sheet). http://www.who.int/end-childhood-obesity/facts/en/ (2014). Accessed May 2017
- 2.Ang YN, Wee BS, Poh BK, Ismail MN. Multifactorial influences of childhood obesity. Curr. Obes. Rep. 2012;2(1):10–22. doi: 10.1007/s13679-012-0042-7. [DOI] [Google Scholar]
- 3.Grundy SM. Multifactorial causation of obesity: implications for prevention. Am. J. Clin. Nutr. 1998;67(Suppl):563S–572SS. doi: 10.1093/ajcn/67.3.563S. [DOI] [PubMed] [Google Scholar]
- 4.Hjelmborg JV, Fagnani C, Silventoinen K, et al. Genetic influences on growth traits of BMI: a longitudinal study of adult twins. Obesity. 2008;16(4):847–852. doi: 10.1038/oby.2007.135. [DOI] [PubMed] [Google Scholar]
- 5.Maes HHM, Neale MC, Eaves LJ. Genetic and environmental factors in relative body weight and human adiposity. Behav. Genet. 1997;27(4):325–351. doi: 10.1023/A:1025635913927. [DOI] [PubMed] [Google Scholar]
- 6.Wardle J, Carnell S, Haworth CM, Plomin R. Evidence for a strong genetic influence on childhood adiposity despite the force of the obesogenic environment. Am. J. Clin. Nutr. 2008;87(2):398–404. doi: 10.1093/ajcn/87.2.398. [DOI] [PubMed] [Google Scholar]
- 7.Locke A, Kahali B, Berndt S, et al. Genetic studies of body mass index yield new insights for obesity biology. Nature. 2015;518(7538):197–206. doi: 10.1038/nature14177. [DOI] [PMC free article] [PubMed] [Google Scholar]
- 8.Frayling TM, Timpson NJ, Weedon MN, et al. A Common Variant in the FTO Gene Is Associated with Body Mas Index and Predisposes to Childhood and Adult Obesity. Science. 2007;316(5826):889–894. doi: 10.1126/science.1141634. [DOI] [PMC free article] [PubMed] [Google Scholar]
- 9.Albuquerque D, Nóbrega C, Manco L. Association of FTO polymorphisms with obesity and obesity-related outcomes in Portuguese children. PLoS One. 2013;8(1):e54370. doi: 10.1371/journal.pone.0054370. [DOI] [PMC free article] [PubMed] [Google Scholar]
- 10.Bradfield J, Taal H, Timpson N, et al. A genome-wide association meta-analysis identifies new childhood obesity loci. Nat. Genet. 2012;44(5):526–531. doi: 10.1038/ng.2247. [DOI] [PMC free article] [PubMed] [Google Scholar]
- 11.Dina C, Meyre D, Gallina S, et al. Variation in FTO contributes to childhood obesity and severe adult obesity. Nat. Genet. 2007;39(6):724–726. doi: 10.1038/ng2048. [DOI] [PubMed] [Google Scholar]
- 12.Scuteri A, Sanna S, Chen WM, et al. Genome-wide association scan shows genetic variants in the FTO gene are associated with obesity-related traits. PLoS Genet. 2007;3(7):e115. doi: 10.1371/journal.pgen.0030115. [DOI] [PMC free article] [PubMed] [Google Scholar]
- 13.Larder R, Cheung MK, Tung YC, Yeo GS, Coll AP. Where to go with FTO? Tends. Endocrinol. Metab. 2011;22(2):53–59. doi: 10.1016/j.tem.2010.11.001. [DOI] [PubMed] [Google Scholar]
- 14.Tung YC, Yeo GS. From GWAS to biology: lessons from FTO. Ann. N.Y. Acad. Sci. 2011;1220(1):162–171. doi: 10.1111/j.1749-6632.2010.05903.x. [DOI] [PubMed] [Google Scholar]
- 15.Buettner C, Pocai A, Muse ED, Etgen AM, Myers MG, Jr., Rosseti L. Critical role of STAT3 in leptin’ s metabolic actions. Cell. Metab. 2006;4(1):49–60. doi: 10.1016/j.cmet.2006.04.014. [DOI] [PMC free article] [PubMed] [Google Scholar]
- 16.Wang P, Yang FJ, Du H, et al. Involvement of Leptin Receptor Long Isoform (LepRb)-STAT3 Signaling Pathway in Brain Fat Mass- and Obesity-Associated (FTO) Downregulation during Energy Restriction. Mol. Med. 2011;17(5-6):523–532. doi: 10.2119/molmed.2010.00243. [DOI] [PMC free article] [PubMed] [Google Scholar]
- 17.Yiannakouris N, Yannakoulia M, Melistas L, Chan JL, Klimis-Zacas D, Mantzoros CS. The Q223R polymorphism of the leptin receptor gene is significantly associated with obesity and predicts a small percentage of body weight and body composition variability. J. Clin. Endocrinol. Metab. 2001;86(9):4434–4439. doi: 10.1210/jcem.86.9.7842. [DOI] [PubMed] [Google Scholar]
- 18.Chagnon YC, Chung WK, Pérusse L, Chagnon M, Leibel RL, Bouchard C. Linkages and associations between the leptin receptor (LEPR) gene and human body composition in the Québec Family Study. Int. J. Obes. Relat. Metab. Disord. 1999;23(3):278–286. doi: 10.1038/sj.ijo.0800809. [DOI] [PubMed] [Google Scholar]
- 19.Chagnon YC, Wilmore JH, Borecki IB, et al. Associations between the leptin receptor gene and adiposity in middle-aged caucasian males from the HERITAGE Family Study. J. Clin. Endocrinol. Metab. 2000;85(1):29–34. doi: 10.1210/jcem.85.1.6263. [DOI] [PubMed] [Google Scholar]
- 20.Baltatzi M, Hatzitolios A, Tziomalos K, Iliadis F, Zamboulis Ch. Neuropeptide Y and alpha-melanocyte-stimulating hormone: Interaction in obesity and possible role in the development of hypertension. Int. J. Clin. Pract. 2008;62(9):1432–1440. doi: 10.1111/j.1742-1241.2008.01823.x. [DOI] [PubMed] [Google Scholar]
- 21.Tao YX. The melanocortin-4 receptor: Physiology, pharmacology, and pathophysiology. Endocr. Rev. 2010;31(4):506–543. doi: 10.1210/er.2009-0037. [DOI] [PMC free article] [PubMed] [Google Scholar]
- 22.García-Solís P, Reyes-Bastidas M, Flores K, et al. Fat mass obesity-associated (FTO) (rs9939609) and melanocortin 4 receptor (MC4R) (rs17782313) SNP are positively associated with obesity and blood pressure in Mexican school-aged children. Br. J. Nutr. 2016;10:1–7. doi: 10.1017/S0007114516003779. [DOI] [PubMed] [Google Scholar]
- 23.Loos RJ, Lindgren CM, Li S, et al. Common variants near MC4R are associated with fat mass, weight and risk of obesity. Nat. Genet. 2009;40(6):768–775. doi: 10.1038/ng.140. [DOI] [PMC free article] [PubMed] [Google Scholar]
- 24.Qi L, Kraft P, Hunter DJ, Hu FB. The common obesity variant near MC4R gene is associated with higher intakes of total energy and dietary fat, weight change and diabetes risk in women. Hum. Mol. Genet. 2008;17(22):3502–3508. doi: 10.1093/hmg/ddn242. [DOI] [PMC free article] [PubMed] [Google Scholar]
- 25.Xi B, Chandak GR, Shen Y, Wang Q, Zhou D. Association between Common Polymorphism near the MC4R Gene and Obesity Risk : A Systematic Review and Meta-Analysis. PLoS One. 2012;7(9):e45731. doi: 10.1371/journal.pone.0045731. [DOI] [PMC free article] [PubMed] [Google Scholar]
- 26.Young EH, Wareham NJ, Farooqi S, et al. The V103I polymorphism of the MC4R gene and obesity: population based studies and meta-analysis of 29 563 individuals. Int. J. Obes. 2009;31(9):1437–1441. doi: 10.1038/sj.ijo.0803609. [DOI] [PMC free article] [PubMed] [Google Scholar]
- 27.Wang D, Ma J, Zhang S, et al. Association of the MC4R V103I polymorphism with obesity: a Chinese case-control study and meta-analysis in 55,195 individuals. Obesity. 2010;18(3):573–579. doi: 10.1038/oby.2009.268. [DOI] [PubMed] [Google Scholar]
- 28.Vidal-Puig AJ, Considine RV, Jimenez-Liñan M, et al. Peroxisome proliferator-activated receptor gene expression in human tissues. Effects of obesity, weight loss, and regulation by insulin and glucocorticoids. J. Clin. Invest. 1997;99(10):2416–2422. doi: 10.1172/JCI119424. [DOI] [PMC free article] [PubMed] [Google Scholar]
- 29.Tan LJ, Zhu H, He H, et al. Replication of 6 obesity genes in a meta-analysis of genome-wide association studies from diverse ancestries. PLoS One. 2014;9(5):e96149. doi: 10.1371/journal.pone.0096149. [DOI] [PMC free article] [PubMed] [Google Scholar]
- 30.Almeida SM, Furtado JM, Mascarenhas P, et al. Anthropometric predictors of body fat in a large population of 9-year-old school-aged children. Obes. Sci. Pract. 2016;2(3):272–281. doi: 10.1002/osp4.51. [DOI] [PMC free article] [PubMed] [Google Scholar]
- 31.Cole TJ, Lobstein T. Extended international (IOTF) body mass index cut-offs for thinness, overweight and obesity. Pediatr. Obes. 2012;7(4):284–294. doi: 10.1111/j.2047-6310.2012.00064.x. [DOI] [PubMed] [Google Scholar]
- 32.Falconer DS. Introductionto Quantitative Genetics. 4th edn. Harlow, Essex: Longmans Green; 1981. [Google Scholar]
- 33.Doney AS, Dannfald J, Kimber CH, et al. The FTO Gene Is Associated With an Atherogenic Lipid Profile and Myocardial Infarction in Patients With Type 2 Diabetes A Genetics of Diabetes Audit and Research Study in Tayside Scotland (Go-DARTS) study. Circ. Cardiovasc Genet. 2009;2(3):255–259. doi: 10.1161/CIRCGENETICS.108.822320. [DOI] [PMC free article] [PubMed] [Google Scholar]
- 34.Do R, Bailey SD, Desbiens K, et al. Genetic variants of FTO influence adiposity, insulin sensitivity, leptin levels, and resting metabolic rate in the Quebec family study. Diabetes. 2008;57(4):1147–1150. doi: 10.2337/db07-1267. [DOI] [PubMed] [Google Scholar]
- 35.Bender N, Allemann N, Marek D, et al. Association between variants of the leptin receptor gene (LEPR) and overweight: a systematic review and an analysis of the CoLaus study. PLoS One. 2011;6(10):e26157. doi: 10.1371/journal.pone.0026157. [DOI] [PMC free article] [PubMed] [Google Scholar]
- 36.Pyrzak B, Wisniewska A, Kucharska A, Wasik M, Demkow U. No association of LEPR Gln223Arg polymorphism with leptin, obesity or metabolic disturbances in children. Eur. J. Med. Res. 2009;14(Suppl 4):201–204. doi: 10.1186/2047-783X-14-S4-201. [DOI] [PMC free article] [PubMed] [Google Scholar]
- 37.Endo K, Yanagi H, Hirano C, Hamaguchi H, Tsuchiya S, Tomura S. Association of Trp64Arg polymorphism of the beta3-adrenergic receptor gene and no association of Gln223Arg polymorphism of the leptin receptor gene in Japanese schoolchildren with obesity. Int. J. Obes. 2000;24(4):443–449. doi: 10.1038/sj.ijo.0801177. [DOI] [PubMed] [Google Scholar]
- 38.Paracchini V, Pedotti P, Taioli E. Genetics of leptin and obesity: a HuGE review. Am. J. Epidemiol. 2005;162(2):101–114. doi: 10.1093/aje/kwi174. [DOI] [PubMed] [Google Scholar]
- 39.Shabana NA, Hasnain S. Association of the leptin receptor Gln223 Arg polymorphism with lipid profile in obese Pakistani subjects. Nutrition. 2015;31(9):1136–1140. doi: 10.1016/j.nut.2015.05.001. [DOI] [PubMed] [Google Scholar]
- 40.Wu Q, Saunders RA, Szkudlarek-Mikho M, Serna Ide L, Chin KV. The obesity-associated Fto gene is a transcriptional coactivator. Biochem. Biophys. Res. Commun. 2010;401(3):390–395. doi: 10.1016/j.bbrc.2010.09.064. [DOI] [PMC free article] [PubMed] [Google Scholar]
- 41.Ohashi J, Naka I, Kimura R, et al. FTO polymorphisms in oceanic populations. J. Hum. Genet. 2007;52(12):1031–1035. doi: 10.1007/s10038-007-0198-2. [DOI] [PubMed] [Google Scholar]
- 42.Grant SF, Li M, Bradfield JP, et al. Association analysis of the FTO gene with obesity in children of Caucasian and African ancestry reveals a common tagging SNP. PLoS One. 2008;3(3):e1746. doi: 10.1371/journal.pone.0001746. [DOI] [PMC free article] [PubMed] [Google Scholar]
- 43.Li H, Wu Y, Loos RJ, et al. Variants in the fat mass- and obesity-associated (FTO) gene are not associated with obesity in a Chinese Han population. Diabetes. 2008;57(1):264–268. doi: 10.2337/db07-1130. [DOI] [PubMed] [Google Scholar]
- 44.Wu J, Xu J, Zhang Z, et al. Association of FTO polymorphisms with obesity and metabolic parameters in Han Chinese adolescents. PLoS One. 2014;9(6):e98984. doi: 10.1371/journal.pone.0098984. [DOI] [PMC free article] [PubMed] [Google Scholar]
- 45.H. Mangge, W. Renner, G. Almer, D. Weghuber, R. Möller, R. Horejsi: Rs9939609 variant of the fat mass and obesity-associated gene and trunk obesity in adolescents. J. Obes. 186368 (2011) [DOI] [PMC free article] [PubMed]
- 46.Gotoda T, Scott J, Aitman T. Molecular screening of the human melanocortin-4 receptor gene: identification of a missense variant showing no association with obesity, plasma glucose, or insulin. Diabetologia. 1997;40(8):976–979. doi: 10.1007/s001250050777. [DOI] [PubMed] [Google Scholar]
- 47.Geller F, Reichwald K, Dempfle A, et al. Melanocortin-4 receptor gene variant I103 is negatively associated with obesity. Am. J. Hum. Genet. 2004;74(3):572–581. doi: 10.1086/382490. [DOI] [PMC free article] [PubMed] [Google Scholar]
- 48.Yilmaz Z, Davis C, Loxton NJ, et al. Association between MC4R rs17782313 Polymorphism and Overeating Behaviours. Int. J. Obes. 2015;39(1):114–120. doi: 10.1038/ijo.2014.79. [DOI] [PMC free article] [PubMed] [Google Scholar]
- 49.Grant SFA, Bradfield JP, Zhang H, et al. Investigation of the locus near MC4R with childhood obesity in Americans of European and African ancestry. Obesity. 2009;17(7):1461–1465. doi: 10.1038/oby.2009.53. [DOI] [PMC free article] [PubMed] [Google Scholar]
- 50.Mato EPM, Pokam-Fosso PE, Atogho-Tiedeu B, et al. The Pro12Ala polymorphism in the PPAR-γ2 gene is not associated to obesity and type 2 diabetes mellitus in a Cameroonian population. BMC Obes. 2016;3(1):26. doi: 10.1186/s40608-016-0104-6. [DOI] [PMC free article] [PubMed] [Google Scholar]
- 51.Carlos FF, Silva-Nunes J, Flores O. Association of FTO and PPARG polymorphisms with obesity in Portuguese women. Diabetes Metab. Syndr. Obes. 2013;6:241–245. doi: 10.2147/DMSO.S45779. [DOI] [PMC free article] [PubMed] [Google Scholar]
- 52.Rolland-Cachera MF, Deheeger M, Maillot M, Bellisle F. Early adiposity rebound: causes and consequences for obesity in children and adults. Int. J. Obes. 2006;30:S11–S17. doi: 10.1038/sj.ijo.0803514. [DOI] [PubMed] [Google Scholar]
Associated Data
This section collects any data citations, data availability statements, or supplementary materials included in this article.