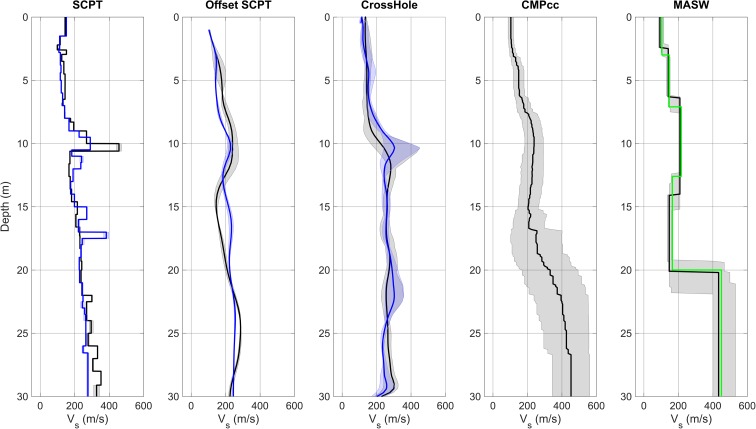
Fig. 13.
VS profiles for station BWSE from different measurement techniques, including uncertainty bands. From left to right: SCPT03 (grey) and SCPT04 (blue) with band indicating variation between left and right blow; average profile for offset SCPTs between 1 and 5 m offset with shaded band indicating the minimum and the maximum VS; cross-hole average profiles for long leg (blue) and short leg (grey) with shaded band indicating the minimum and the maximum VS; CMPcc based on MASW array, shaded band indicates standard deviation of the 72 best models; MASW with manual fit in green and automatic inversion using the genetic algorithm in black with grey shaded band indicating the minimum and the maximum VS.

