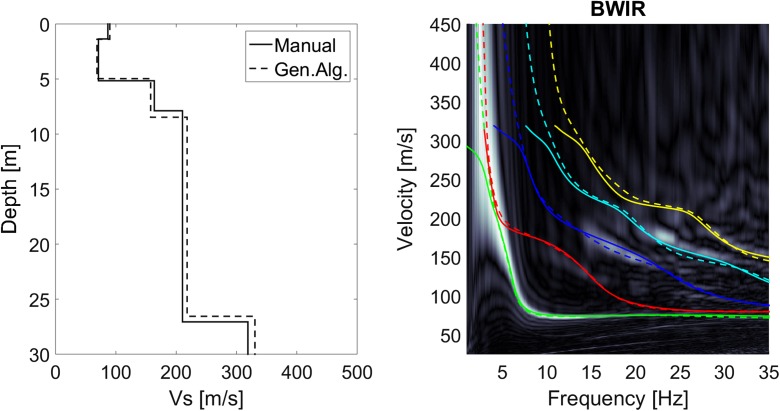
Fig. 8.
MASW result for station BWIR. Left: VS profiles from the manual optimisation (solid line) and the genetic algorithm (dashed line). Right: dispersion plot showing the energy in the velocity- frequency domain in grey scale and the theoretical dispersion curves for the VS profiles of the left panel for the manual optimisation (solid line) and the genetic algorithm (dashed line). The fundamental mode is shown in green; the higher modes in red, blue, cyan and yellow

