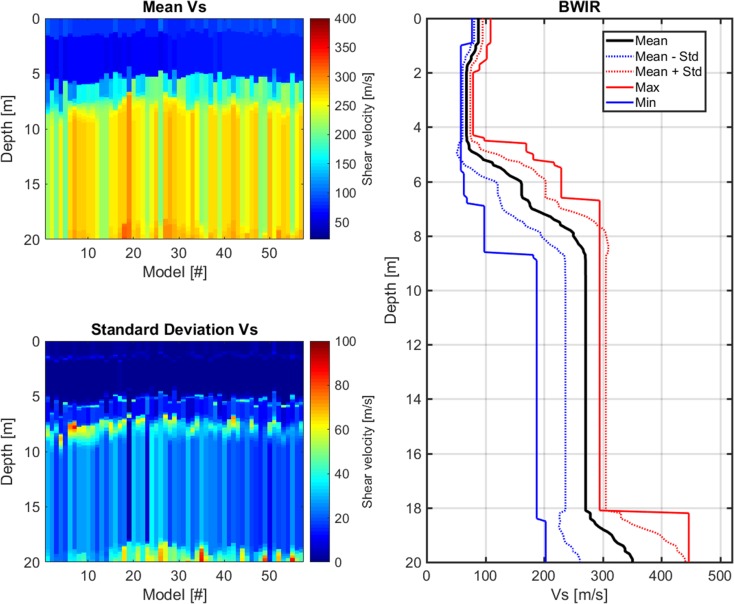
Fig. 9.
CMPcc result for station BWIR. Top left: mean of best VS models for the 72 CMPcc gathers along the line. Bottom left: standard deviation of best VS models for the 72 CMPcc gathers along the line. Right: best fit curve of the 72 models with the maximum and minimum value observed in the whole CMPcc and the standard deviation from all models

