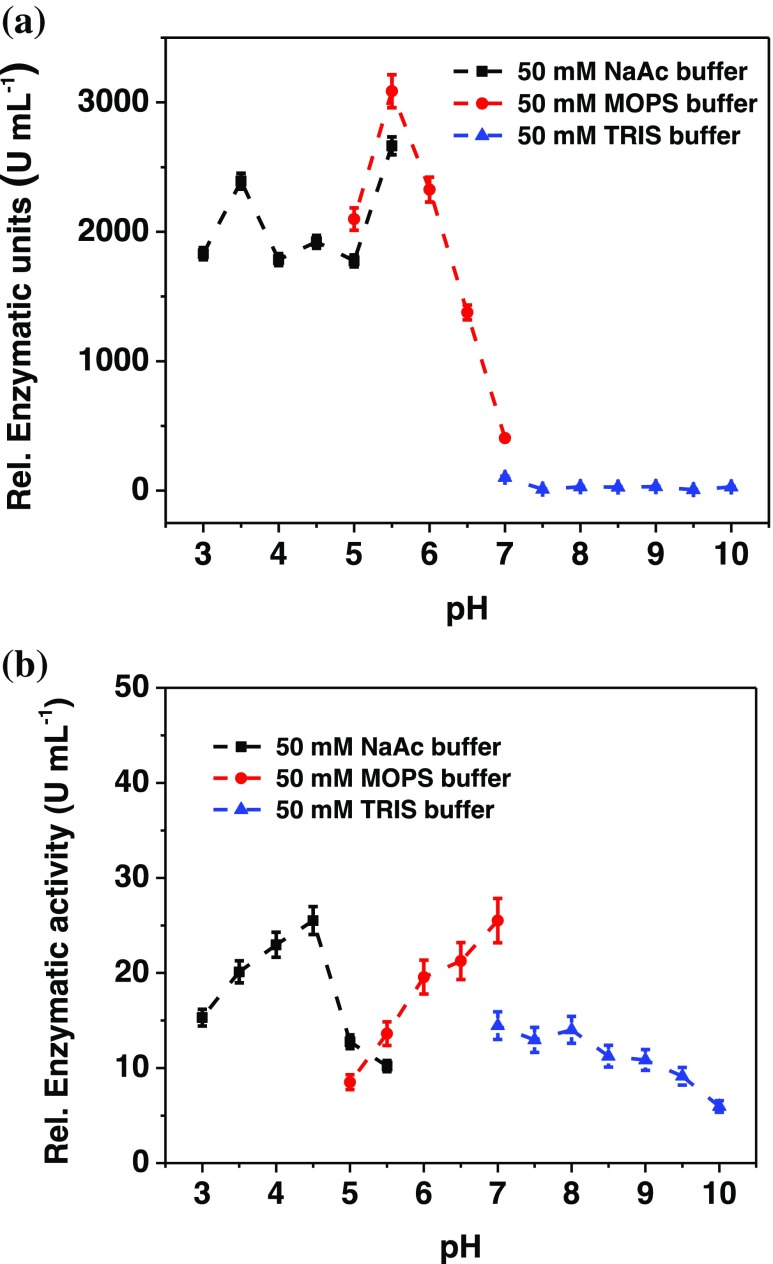
Fig. 2.
Dependence of the relative activities of (a) DCIP and (b) cyt c on pH carried out in 50 mM NaAc buffer (pH 3–5.5, black), 50 mM MOPS buffer (pH 5–7, red), and 50 mM TRIS buffer (pH 7–10, blue). Experimental conditions: [fructose]: 30 mM, [cyt c]: 100 μM, and [2,6-dichloroindophenol, DCIP]: 300 μM

