Fig. 2.
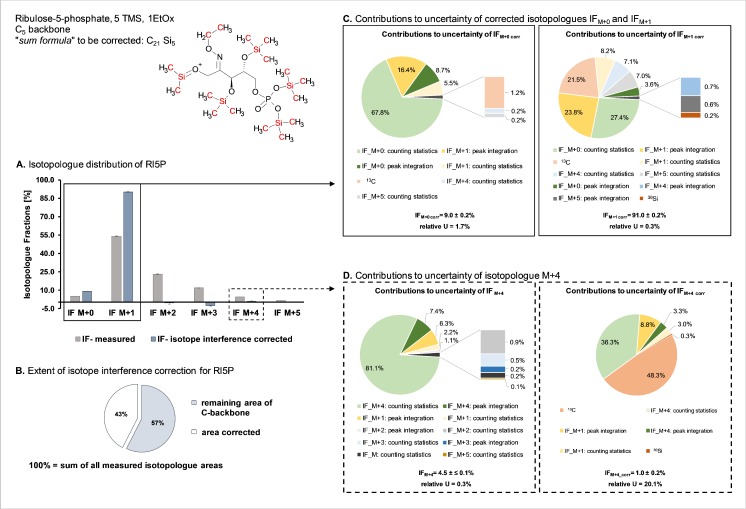
Contributions to the measurement uncertainty of selected isotopologue fractions (IFs) of ribulose 5-phosphate (Rl5P). Data were obtained from a metabolic flux experiment using [1,6-13C2]glucose as a tracer molecule. The depicted chemical structure of the fully derivatized Rl5P [M − CH3]+ ion highlights in red the naturally abundant elements introduced by derivatization, necessitating an interference correction. The bar graph in part A shows the isotopologue distributions obtained for the six isotopologues of Rl5P; the isotopologue distribution obtained by gas chromatography–chemical ionization time-of-flight mass spectrometry measurement [25] is shown in gray, whereas the IFs after isotope interference correction are depicted in blue. Part B illustrates the extent of naturally abundant isotope interference by a pie chart: if the sum of all measured isotopologue peak areas is considered to be 100%, 43% stem solely from derivatization groups. The pie charts in part C show the contributions to the uncertainty of IFM+0corr and IFM+1corr, whereas in part D the pie charts indicate the contributions to uncertainty before (i.e., IFM+4) and after (i.e., IFM+4corr) isotope interference correction. EtOx ethoxime, TMS trimethylsilyl

