
Figure 1. BM pDC progenitors are reduced in number and have compromised capacity to generate functional pDCs long-term after chronic LCMV infection. See also Figures S1 and S2.
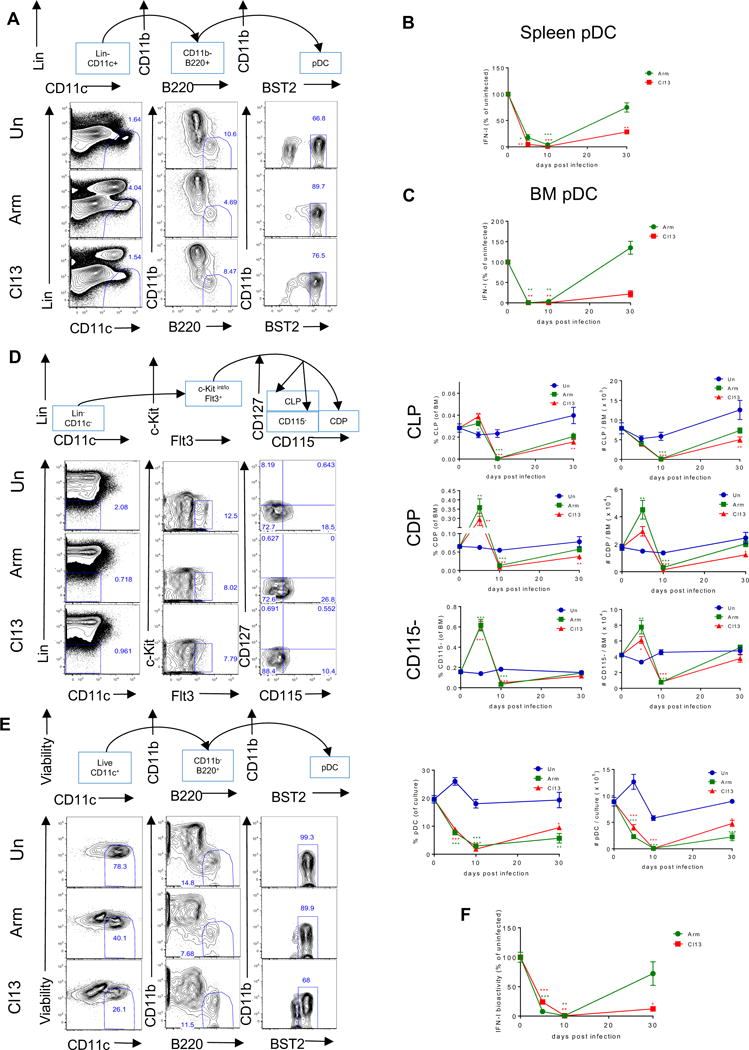
Wild-type (WT) mice were infected with LCMV ARM (green) or Cl13 (red) or left uninfected (blue) and sacrificed at days 5, 10, and 30 p.i. (A) Representative flow cytometric analysis of pDCs as Lin−CD11c+CD11b−B220+BST2+ in spleen at day 10 p.i. Lineage-negative gating (Lin) includes markers for Thy1.2, CD19, and NK1.1. (B-C) FACS-purified splenic pDCs (B) or BM pDCs (C) were stimulated with CpG-B for 15 hours and IFN-I activity in the supernatant was quantified. Graphs depict the percentage change in IFN-I activity normalized to the uninfected mice processed in parallel at each time point. (D) Representative flow cytometric analysis of BM pDC progenitors at day 10 p.i. where CLPs were identified as Lin−c-kitint/loFlt3+CD115−CD127+, CDPs as Lin−c-kitint/loFlt3+CD115+CD127−, and CD115− as Lin−c-kitint/loFlt3+CD115−CD127−. Lin includes markers for Thy1.2, CD19, NK1.1, CD3, CD4, CD8, B220, CD11b, Gr-1, and Ter119. Graphs depict the percentage (left) and the absolute number (right) of indicated progenitors in BM at each time point. (E) BM cells were cultured with Flt3L and pDCs were identified as CD11c+CD11b−B220+BST2high at day 8 post-culture. Representative FACS plots for BM-Flt3L-derived pDCs and graphs depicting their percentage (left) and absolute number (right) in the culture are shown. (F) FACS-purified BM-Flt3L-derived pDCs were stimulated with CpG-A for 15 hours and IFN-I activity in the supernatant was quantified. Graph depicts the percentage change in IFN-I activity normalized to the culture from uninfected mice processed in parallel at each time point. Graphs depict mean ± SEM. Data are representative of 2-3 independent experiments with 3-10 mice/group. *p<0.05, **p<0.01, ***p<0.001 (one-way Anova to compare ARM-infected (green asterisks) and Cl13-infected (red asterisks) groups to uninfected group processed in parallel at each time point).