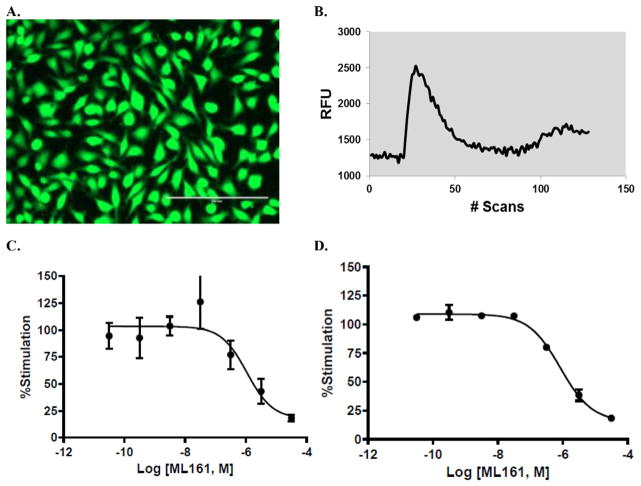
Fig. 3.
A: Adherent Ea.hy926 cells containing Fluo-4 dye. Cells were imaged in a clear-bottom, black wall 96-well plate, using an Evos Fl inverted microscope (20X) with GFP setting. B: Representative Fluo-4-Ca2+ emission curve (525 nm) in response to TFLLRN-NH2 (3.16 μM). C: Concentration–response curve of a typical (unsuccessful) assay with the PAR1 antagonist ML161 and 3.16 μM TFLLRN-NH2 before optimization (manual media exchanges), n = 3. D: Representative concentration–response curve with the PAR1 antagonist ML161 and 5 μM TFLLRN-NH2 after assay optimization (automated liquid handling).

