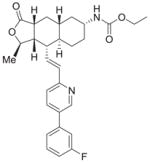
Table 1.
Inhibition data of select antagonists in the PAR1-mediated iCa2+ mobilization assay.
| Entry | ID# | Structure | % Inhibition & IC50a | Log IC50 ± Std. Error |
|---|---|---|---|---|
| 1 | Vorapaxar |

|
95%; 0.032 μM |
− 7.5 ± 0.084 |
| 2 | Atopaxar |

|
94%; 0.033 μM |
− 7.5 ± 0.10 |
| 3 | RWJ-58259 11a |

|
94%; 0.020 μM |
− 7.7 ± 0.065 |
| 4 | DG-207 12 |

|
76%; 0.29 μM |
− 6.5 ± 0.074 |
| 5 | ML161 16 |

|
82%; 0.85 μM |
− 6.7 ± 0.099 |
| 6 | CJD-125 17 |

|
74%; 3.16 μMb |
N.D. |
| 7 | EMG-21 18 |

|
68%; 3.31 μM |
− 5.5 ± 0.26 |
| 8 | EMG-23 19 |

|
49% | N.D. |
| 9 | RR-90 21 |

|
77%; 0.97 μM |
− 6.0 ± 0.19 |
| 10 | DG-5 26 |

|
77%; 94 μM |
− 4.0 ± 2.9 |
| 11 | RR-10 20 |

|
79%; 81 μM |
− 4.0 ± 5.1 |
%Inhibition of PAR1 antagonists in presence of 5 μM TFLLRN-NH2. N.D. = not determined.
Estimated IC50 (incomplete curve at high concentration).
