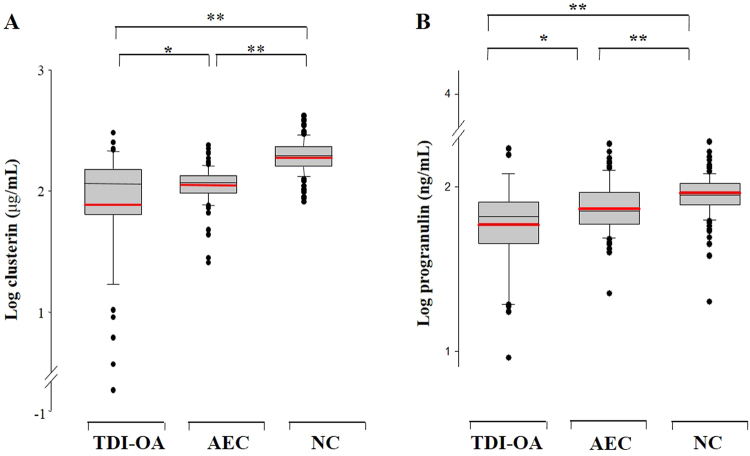
Fig. 1.
Comparison of serum clusterin (a) and progranulin levels (b) in the three study groups. Statistically significant differences among the groups were assessed by ANCOVA. Box-and-whisker plots represent the 25th and 75th percentiles, with the median lines and error bars representing the 10th and 90th percentiles. The red line indicates the mean value for each group. *P < 0.05; **P < 0.001. TDI-OA TDI-induced occupational asthma, AEC asymptomatic exposed control, NC unexposed healthy normal control

