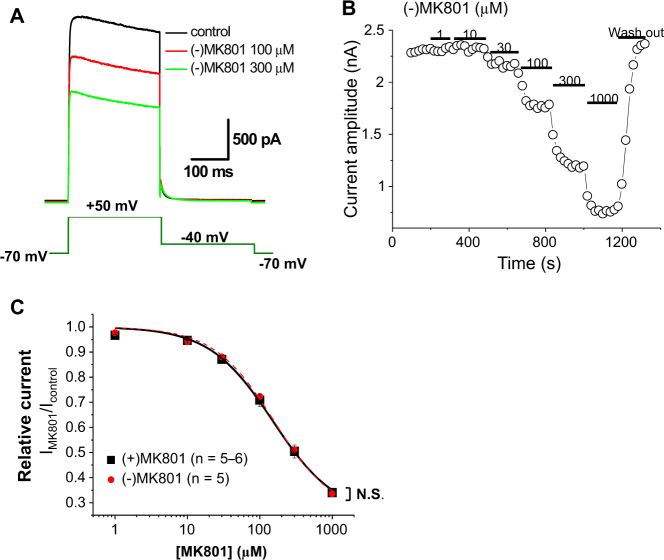
Fig. 2. Inhibition of Kv1.5 currents by MK801 enantiomers recorded from CHO cells overexpressing Kv1.5.
a Representative Kv1.5 current tracings elicited by voltage steps shown in the figure inset in the absence and presence of MK801 (100 and 300 µM). b Kv 1.5 current amplitudes at + 50 mV are plotted against time. The period of application of various concentrations of MK801 is indicated as solid bars. c CRCs of (+) and (−) MK801 enantiomer-induced Kv1.5 inhibition. N in parentheses indicates the number of cells examined. N.S. not significant

