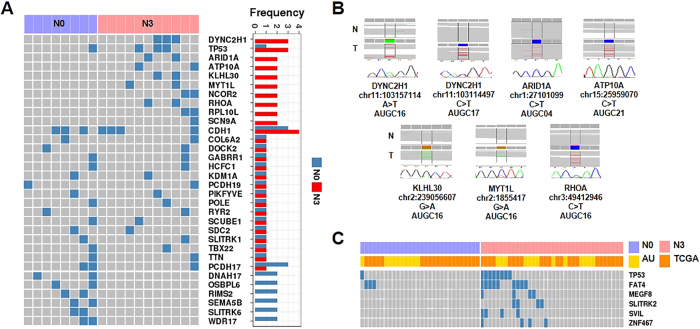
Fig. 4. Comparison of recurrent mutations in N0 and N3 tumors.
a A heatmap showing 32 recurrent SDMs in DGC. A bar plot indicating mutations of N0 (red) and N3 (blue) tumors. Rows are ordered by the differential frequency between N0 and N3 subgroups. b N3 tumor-specific SDMs that were validated by the Sanger sequencing method. The read alignments were evaluated using Integrated Genome Brower (IGV) software. c A heatmap showing recurrently mutated genes in N3 tumors (Fisher’s exact test for N0 vs. N3, P < 0.05) compared to those in N0 tumors collected from our data and TCGA data

