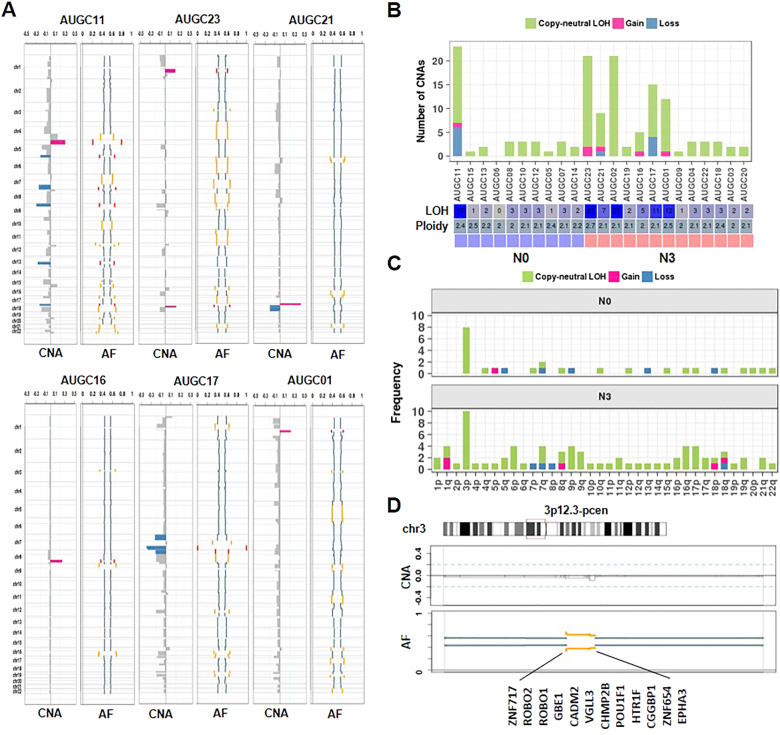
Fig. 5. DNA copy number aberrations in DGC.
a Chromosomal views show the DNA copy number aberration (CNA) and allele frequency (AF) of each tumor. Copy number gains (red) and losses (blue) are shown in chromosomal CNA views (left). Copy-neutral LOH (orange) and LOH with gains or losses (red) are shown (right). b A bar plot showing the frequency of CNAs in each DGC tumor (top). Copy number gains (red), losses (blue) and copy-neutral LOHs (green) are shown. A heatmap showing relative numbers of LOHs and the ploidy of each tumor (bottom). c Bar plots showing the frequency of CNAs across chromosome arms in N0 (top) and N3 (bottom) tumors. d A plot showing copy-neutral LOHs (orange) at the 3p12-pcen region and the 12 genes within this region

