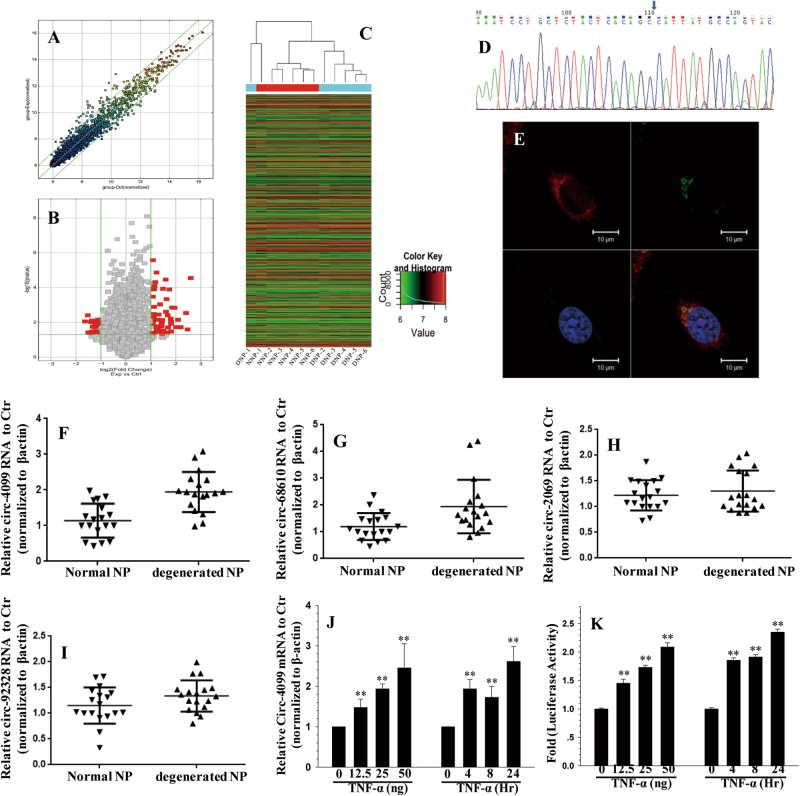
Fig. 1. circRNA profile in IVDD.
a Scatter plot of circRNA expression. The circRNAs above the top green line and below the bottom green line indicated more than a twofold change between the degenerated and normal IVD NP tissues. b Volcano Plot of the differentially expressed circRNAs. The red points in the plot represent differentially expressed circRNAs with statistical significance. c Hierarchical clustering shows the distinguishable circRNA expression profile between the two groups and homogeneity within the groups. d The sequence of the amplified Circ-4099 product was completely consistent with CircBase. e Co-localization between circ-4099 (red) and miR-616-5p (green) was observed by RNA in situ hybridization in hNP cells after co-transfection with circ-4099-expressing and miR-616-5p-expressing vectors. The nuclei were stained with DAPI (blue). Scale bar = 10 µm. f The expression levels of circ-4099 are significantly higher in degenerated NP tissues than in non-degenerated NP tissues. g–i The expression levels of circ-68610/2069/92328 are higher in degenerated NP tissues than in non-degenerated NP tissues. j qRT-PCR analysis shows that TNF-α upregulates the expression of circ-4099 in a dose-dependent and time-dependent manner. For time-dependent studies, 50 ng/ml TNF-α was used. k hNP cells were transfected with the circ-4099-Luc promoter and the induction in luciferase activity was measured following TNF-α treatment (P < 0.001)

