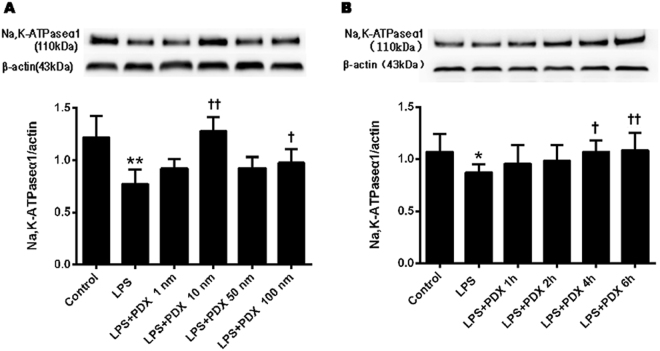
Fig. 5. Dose and time dependency of protectin DX regulation of Na, K-ATPase expression in primary ATII cells.
The dose- and time-dependent changes in Na, K-ATPase protein expression levels in primary ATII cells stimulated with LPS (1 µg/ml) were determined by western blotting. Cells were incubated for 6 h with different concentrations of protectin DX, including 3.605 × 10⁻⁴, 3.605 × 10⁻³, 18.025 × 10⁻³, and 3.605 × 10⁻¹ mg/l, to measure Na, K-ATPase α1 subunit protein expression levels (a). Moreover, ATII cells were incubated with LPS (1 µg/ml) for 1, 2, 4, and 6 h to detect Na, K-ATPase α1 subunit protein expression levels (b). The data are presented as the mean ± SD. n = 8. PDX protectin DX. *p < 0.05, **p < 0.01 versus the control group; †p < 0.05, ††p < 0.01 versus the LPS group

