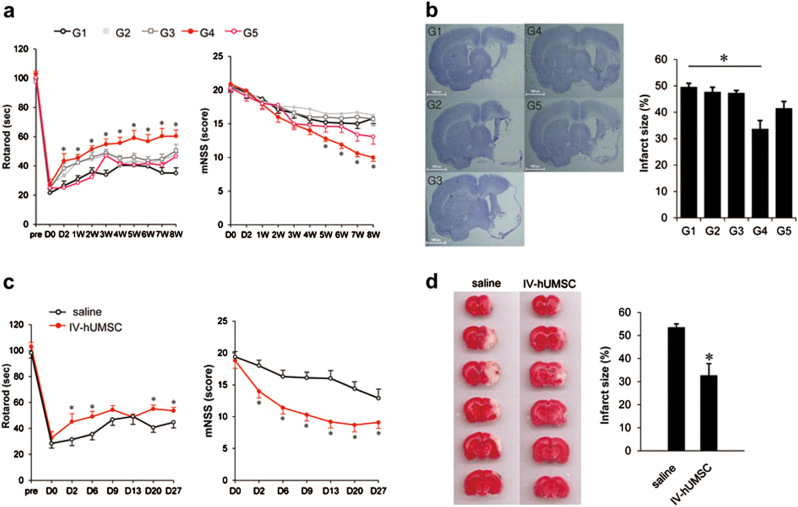
Fig. 1. Functional tests and infarct size of MCAo rats treated with IV-hUMSCs.
a Rotarod test (left panel) and mNSS (right panel) test in MCAo rats with various treatment paradigms of IV-hUMSCs (n = 10 in each group). D0 represents the day of MCAo induction in rats. The data were analyzed using the mixed ANOVA test. *p < 0.05 between G1 group and G4 group. b Infarct size using Cresyl violet staining at 8 weeks post MCAo in rats treated with IV-hUMSCs at various cell doses and delivery time points (n = 7 for each group). c Rotarod test (left panel) and mNSS (right panel) test of an independent study of IV-hUMSCs at 1 × 10⁶ cells at 24 h post MCAo (n = 10 in each group). The data were analyzed using the mixed ANOVA test. d Measurement of infarct size using 2, 3, 5-triphenyltetrazolium chloride (TTC) staining at 72 h post MCAo in an independent study of IV-hUMSCs at 1 × 10⁶ cells at 24 h after MCAo (n = 5 in each group). All data are presented as the mean ± SEM. *p < 0.05

