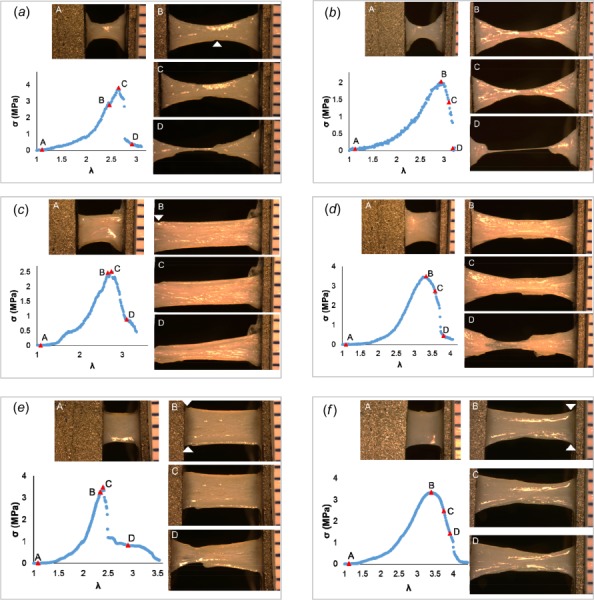
Fig. 3.

Failure process in sheep carotid artery specimens. Four levels of deformation during loading to failure are shown: Row 1: DB-FT for (a) #S2 and (b) #S7; Row 2: Rect-FT for samples (c) #S13 and (d) #S15; as well as Row 3: Rect-SP for (e) #S19 and (f) #S21. Location of crack that led to catastrophic failure is marked by a white arrowhead, where identifiable. Adventitial side of specimen is facing camera.
