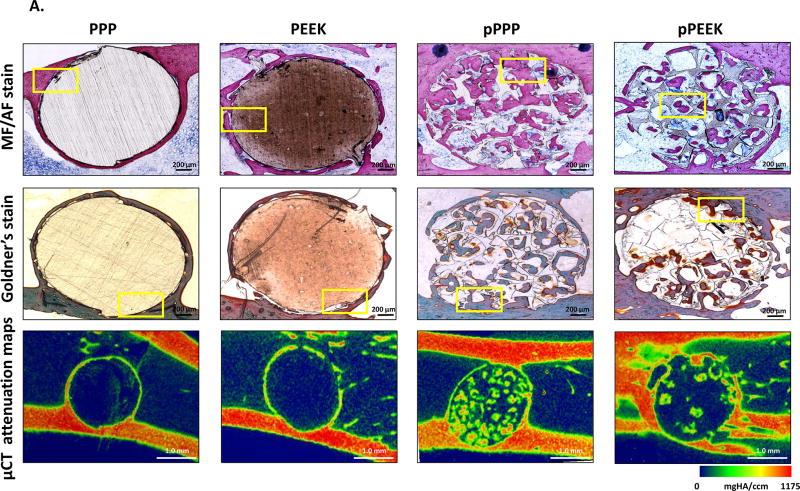
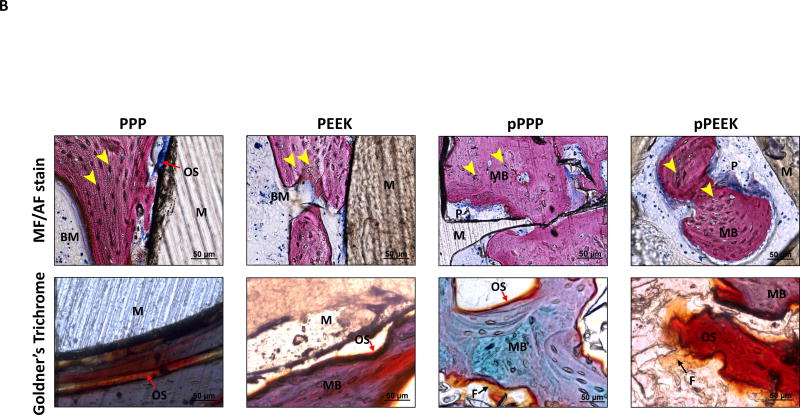
Figure 5. Osseointegration of implant and bone ingrowth.
To demonstrate bone ingrowth, implanted bones were harvested at 8-weeks post-op and evaluated via methylene blue acetic fuchsin staining, Goldner’s trichrome staining and representative mineral attenuation maps from micro-CT (n=1) (A) coronal section of implant with adjacent tissue, (B) higher magnification of selected regions (yellow box). Histology suggested bone interaction with solid scaffold surfaces and ingrowth throughout the porous structure. Notably, pPPP showed enhanced cellularization and substantial bone formation. MB (Matured bone, stained as pink from MF/AF staining or purple to green from Goldner’s staining); M (Material, stained as brown); OS (Osteoid seam, red arrow); F (Fibrotic tissue, black arrow); Osteocyte (yellow arrowhead); BM (Bone marrow); P (Inner pore structure). Scale bars: 200 µm (original), 50 µm (higher magnification)


