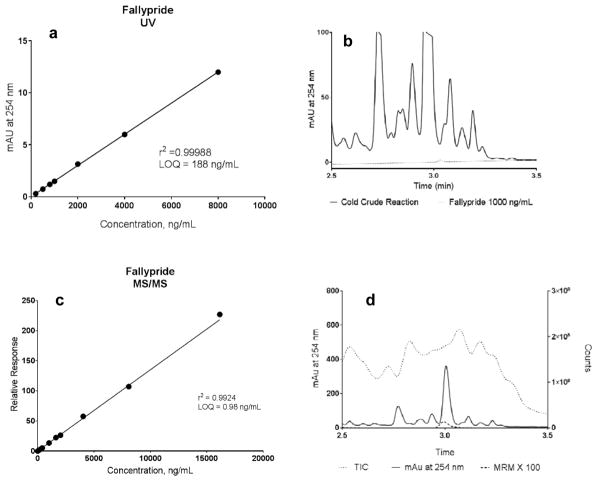
Figure 1.
Comparison between UV and MS/MS detection. a) Calibration curve for UV detection, LOQ = 188 ng/mL; b) UV chromatogram of a representative 19F-synthesis (solid) vs. fallypride standard at 1000 ng/mL (dot); c) Calibration curve for MS/MS detection, LOQ = 0.98 ng/mL; d) MS/MS chromatogram of a representative 19F-synthesis: total ion chromatogram (TIC, dot), UV 254 nm (solid) and fallypride signal in MRM mode (×100 amplified, dash)

