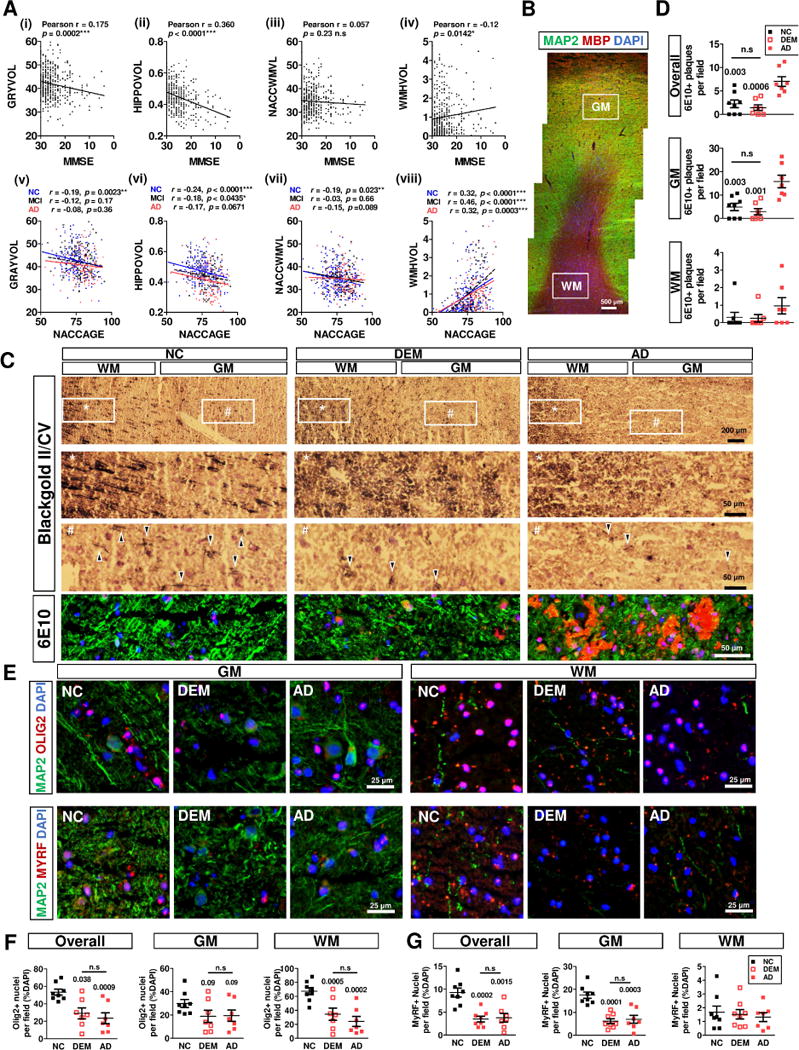
Fig. 1. Myelin injury and oligodendrocyte degeneration are associated with cognitive decline, but independent of amyloid plaques.

A The summarized MRI data of GM (GRAYVOL), Hippocampus (HIPPOVOL), Total WM (NACCWMVL) and WM hyperintensity (WMHVOL) were correlated with cognition graded by MMSE (i–iv) and age (v–viii) by Pearson test respectively. B Frontal cortex specimen with distinct cortical gray matter (GM, MAP2, Green) and subcortical white matter (WM, MBP, Red). C upper panel The myelin in the subcortical WM (*) were comparable among groups, but the extent of intracortical myelin fibers (Blackgold II/Cresyl violet, arrowheads) were similar reduced in DEM and AD cortices (#).C lower panel Amyloid plaques density (6E10, red) is significantly higher in the AD group, compared with DEM and age-matched NC subjects (g, h, i).D The density of the amyloid plaques in the fontal cortex were quantified and agrees with neuropathology reports (Table S2). E upper panel The OL lineage (Olig2, red) and lower panel the mature OL subpopulations (MyRF, red) were identified in both GM and WM from all subjects. F Quantification revealed a significant reductions of Olig2+ population in both GM and WM in in DEM and AD group; G the number of MyRF+ mature OL was only reduced in the GM in DEM and AD.
