
Fig. 6. DNA damage directly induced aberrant re-expression of cell cycle protein in postmitotic, mature oligodendrocyte.
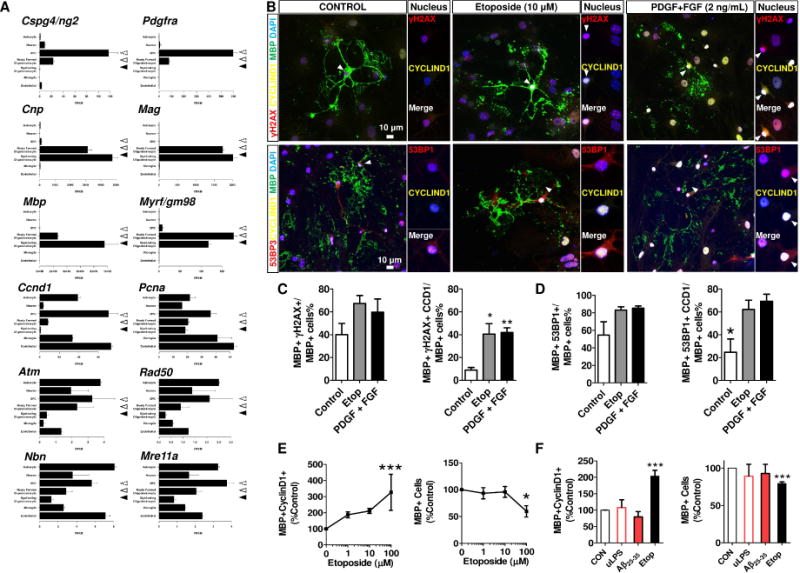
A The RNA-seq data was adopted from the database stabled by Barres Lab in the public domain – http://web.stanford.edu/group/barres_lab/brainseqMariko/brainseq2.html (Zhang et al 2014). The reproduction of these data were made with written permission from the corresponding author. The cell-stage specificity of the OL population was validated by the expression of OPC genes (Cspg4, and Pdgfra) in the progenitor cells (dashed arrowheads), andhe expression of myelin and mature OL genes (Cnp, Mag, Mbp and Myrf) in the newly formed oligodendrocytes (open arrowhead) and myelinating oligodendrocyte (filled arrowhead). Of note, the expression of cell cycle markers, Ccnd1 (cyclin D1) and Pcna were attenuated along the differentiation axis of OL, and the expression of ATM family were the lowest in myelinating oligodendrocytes B The direct application of DSB-inducing agent, etoposides (10 μM, 24h) or OL-specific mitogens (PDGF-AA+bFGF, 2 ng/mL), similarly induced DSB foci formation labelled by γH2AX, (upper panel, red) and 53BP1 (lower panel, red) in the MBP expressing mOL (green). Of note, the aberrant re-expression of Cyclin D1 (arrow, yellow) remarkably increased in these mature mOL with DSBs. C, D Quantifications of cyclin D1 in the mOL population with DSBs. E Etoposide induced aberrant Cyclin D1 expression and reduced mature OL population in a dose-dependent fashion (0 – 100 μM, 24 h). F Only application of etoposide (10 μM, 24h), but not Lipopolysaccharide-induced inflammation (uLPS, 0.1 μg/mL, 24 h) nor soluble Aβ25-35 peptide mixture (10 μM, 24 h) induced abnormal expression of cyclin D1 in mature OL (unpaired t-test, n=3).