Figure 4.

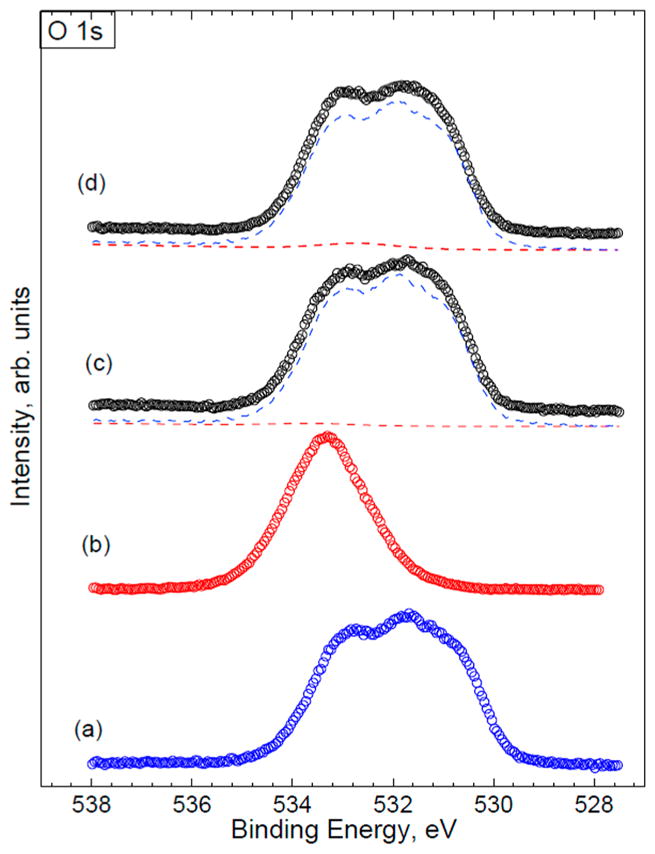
Example of the O 1s peak curve-fit: (a) PVPVA (reference spectrum); (b) NAP (reference spectrum); (c) Batch 1 (PVPVA component is blue; NAP component is red); (d) Batch 2 (PVPVA component is blue; NAP component is red).

Example of the O 1s peak curve-fit: (a) PVPVA (reference spectrum); (b) NAP (reference spectrum); (c) Batch 1 (PVPVA component is blue; NAP component is red); (d) Batch 2 (PVPVA component is blue; NAP component is red).