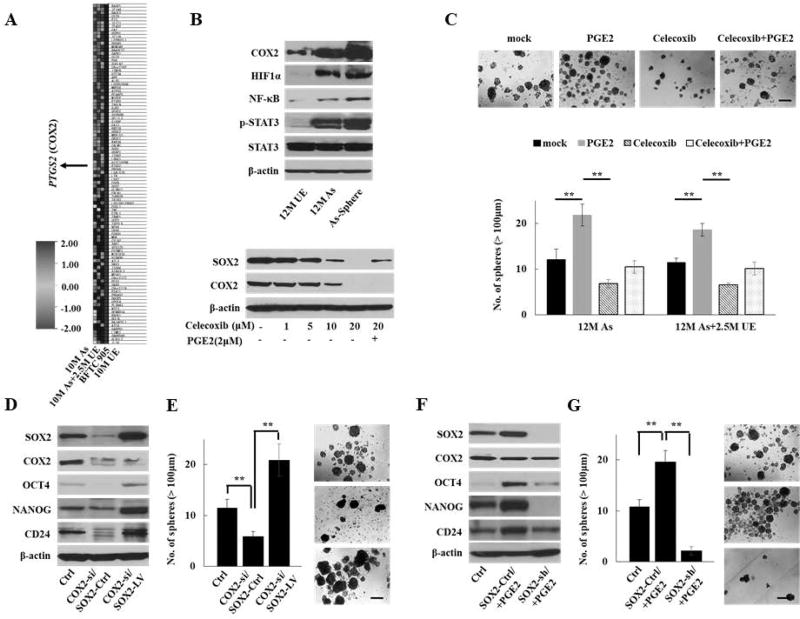
Figure 3.
COX2/PGE2-SOX2 axis in maintaining malignant stem cells. (A) Heat map of top 50 genes with the most enriched score determined by GSEA for the oncogenic signatures on 10M As-cells, 10M As-cells cultured without arsenic for 2.5 months (10M As+2.5M UE-cells), and BFTC905 cells compared with 10M UE-cells. PTGS2 (encoding COX2) was one of the top 50 genes with the most enriched score. (B) Western blotting of inflammation-related molecules, including COX2 in parental or spheroid As-cells compared with UE-cells (upper) and dynamics of SOX2 and COX2 expression after treatment with COX2 inhibitor celecoxib for 72 hours ± PGE2 (2 µM) for 24 hours in As-cells (lower). (C) Sphere formation assay in 12 M As-cells or 12M As-cells that were cultured for 2.5M without arsenic (12M As+2.5M UE) treated with celecoxib (10 µM) and/or PGE2 (2 µM) for 72 hours. Upper: representative images (scale bars, 200 µm). Lower: Bar graph of number of spheres of indicated cell lines. Data are from 3 independent experiments. (D) Western blotting of SOX2, COX2, and stemenss-related molecules after forced expression of SOX2 in COX2 knockdown As-cells. (E) Sphere formation assay after forced expression of SOX2 in COX2 knockdown 12M As-cells (scale bars, 200 µm). (F) Western blotting of SOX2, COX2, and stemenss-related molecules after knockdown of SOX2 in 12M As-cells treated with PGE2. (G) Sphere formation assay after knockdown of SOX2 in 12M As-cells treated with PGE2 (scale bars, 200 µm). Each error bar indicates mean ± SEM. * P <0.05, ** P <0.01 [Kruskal-Wallis with post-hoc test (C, E, and G)].

