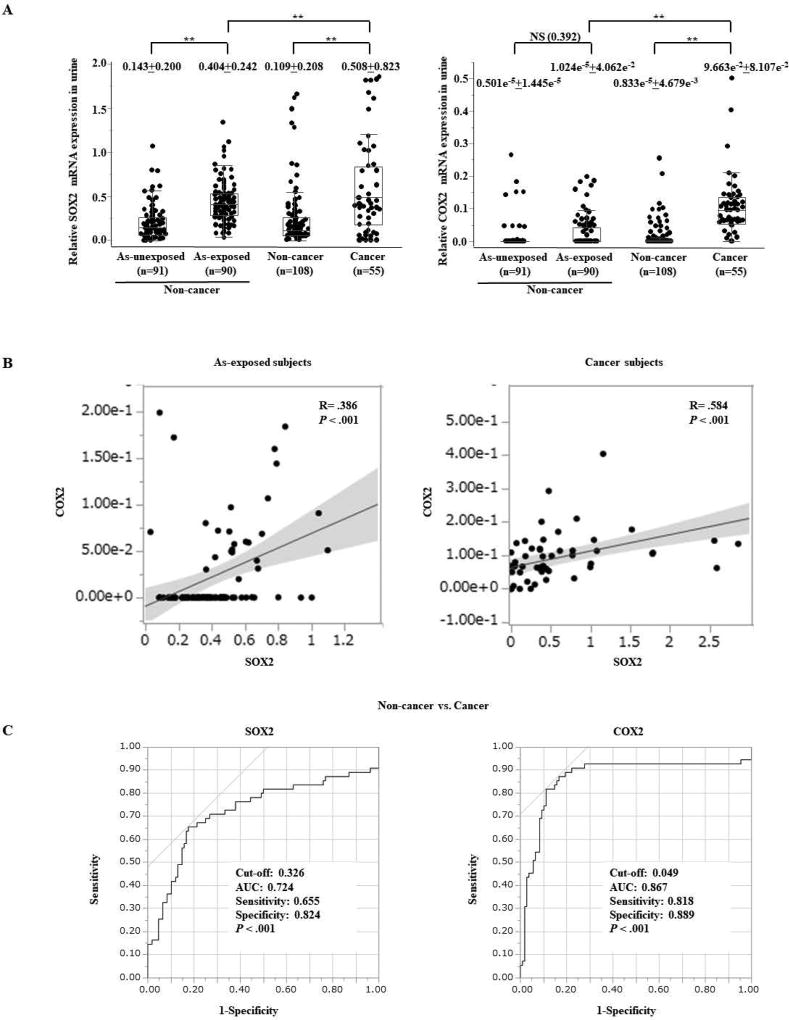
Figure 4.
Elevated expression of SOX2 and COX2 in urine samples from non-cancer arsenic exposed and UCB subjects compared with controls. (A) Box plots of SOX2 (left) and COX2 (right) expression measured by Q-RT-PCR in urine from arsenic (As)-unexposed (n=91) and exposed (n=90) non-cancer subjects; and from UCB (n=55) and population-matched control subjects (n=108). The median ± interquartile range is shown. NS, not significant; ** P < 0.01 (Kruskal-Wallis with post-hoc test). (B) A linear correlation analysis between mRNA expression status of SOX2 and COX2 in arsenic (As)-exposed subjects (left) and in UCB subjects (right) using Pearson product-moment. (C) A receiver operating characteristic curve (ROC) analysis of SOX2 (left) and COX2 (right) for non-invasive cancer detection using urine samples from 55 UCB subjects and 108 population-matched control subjects.

