
Figure 1. sci-MET assay and performance.
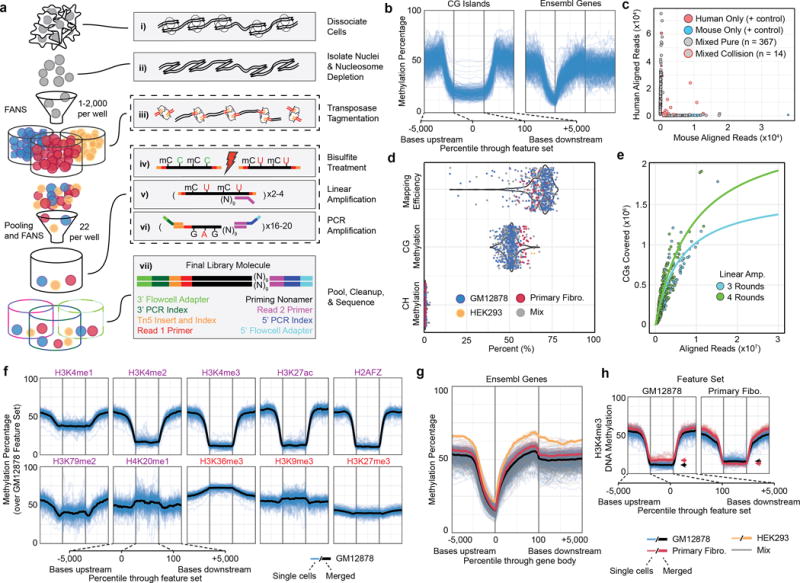
a. The sci-MET workflow. b. Methylation rates for single GM12878 cells (n=283 cells) over CG islands (left) and gene bodies (right). c. sci-MET of mixed mouse and human cells using xSDS nucleosome depletion to estimate barcode collisions. (n=566 cells). d. Mapping efficiency, global CG methylation and global CH methylation for a mix of human cell lines (n=641 cells). e. The number of CG dinucleotides covered by the total aligned reads per cell. f. Methylation rates for GM12878 cells. (Purple are generally activating and red are generally repressive features). g. Methylation rates for the three cell types over annotated genes. h. Methylation rates over GM12878 and Primary Fibroblast ENCODE H3K4me3 ChIP-seq peaks. Arrows indicate the mean for the feature set.