
Figure 2. sci-MET identifies single-cell methylomes by cell type.
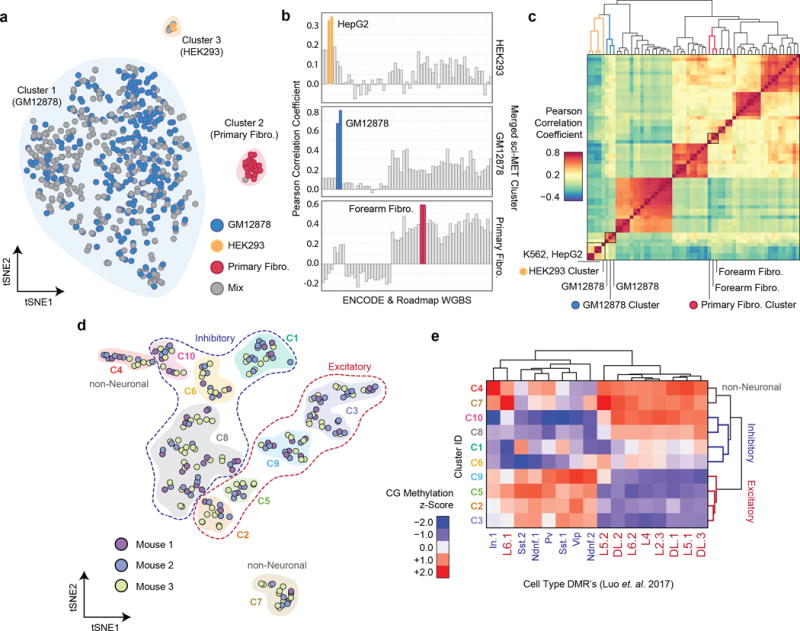
a. NMF-tSNE projections of single-cell methylomes. Clusters are indicated by a shaded background b. Single-cell methylomes (n=641 cells) were aggregated over the three clusters and then correlated with publically available whole genome bisulfite sequencing data. Closely matched cell types are in color. c. Hierarchical clustering on the Pearson correlation values of HEK293, GM12878, and Primary Fibro. d. NMF-tSNE projection of cortical cells based on CG and CH methylation. Clusters are indicated by a shaded background and grouped by class using dashed lines. e. Methylation z-score heatmap of aggregate cell clusters over previously described DMRs (n=285 cells).