
Fig. 2.
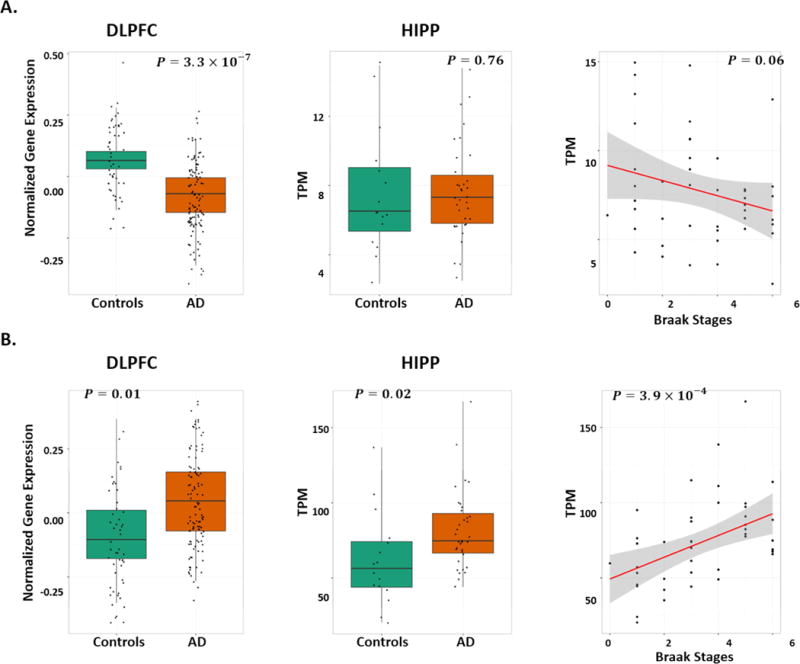
Expression studies of (A) C14orf79 and (B) MTUS1 including boxplots for differentially expressed genes in the brain dorsolateral prefontal cortex (DLPFC) in the microarray data (GEO: GSE44772; left column) and in the hippocampus (HIPP) in the RNA-Seq data (Eisai Bio Bank data; middle column), and regression plots of gene expression by Braak stage in the RNA-Seq data (Eisai Bio Bank data; right column). P-values in plots were computed from linear regression models after adjusting for covariates (details in the Methods).