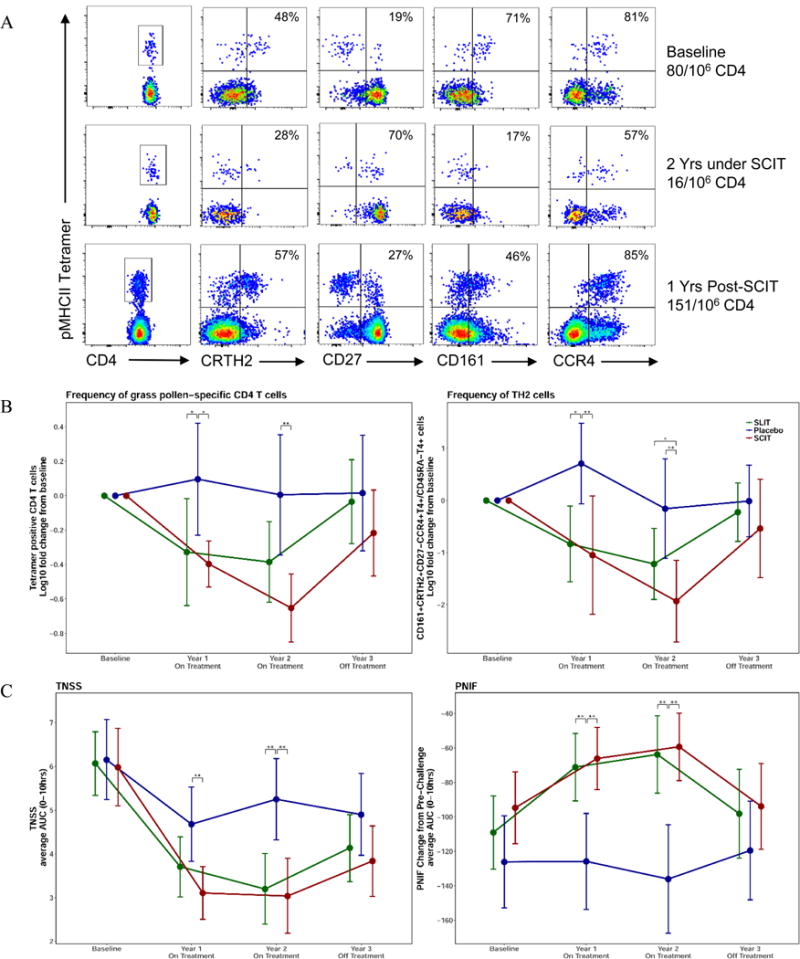
Fig. 1.

Analysis of allergen-specific CD4 T cells and relationship to the clinical parameters measured during the GRASS trial. (A) Representative flow cytometry analysis of tetramer bound allergen-specific T cells from a study subject receiving subcutaneous allergen immunotherapy. Lymphocytes that bind the pooled tetramers are displayed on the y axis and expression of phenotypic cell surface markers CD4, CRTH2, CD27, CD161 and CCR4 are displayed on the x axis at baseline, at 2 years after continuous SCIT therapy and at 3 years after one year off therapy. (B) Frequencies of allergen-specific CD4 T cells were determined for 53 HLA-DR4 subjects in the GRASS trial, by tetramer binding (left panel). Frequencies of Th2 cells are identified by CD161+CRTH2+CD27−CCR4+T4+/CD45RA−T4+ phenotypic marker expression (right panel). (C) The total nasal symptom score (TNSS) average AUC (left panel) and the peak nasal inspiratory flow (PNIF) average AUC (right panel) for 0–10 hours following allergen challenge were measured at baseline and years 1–3 for all participants treated with sublingual immunotherapy (green), subcutaneous immunotherapy (red), and placebo (blue). Significant differences are indicated by * (p<.05), ** (p<.01). Data are shown as means with 95% confidence intervals, for the 84 per-protocol subjects enrolled in the GRASS trial.
