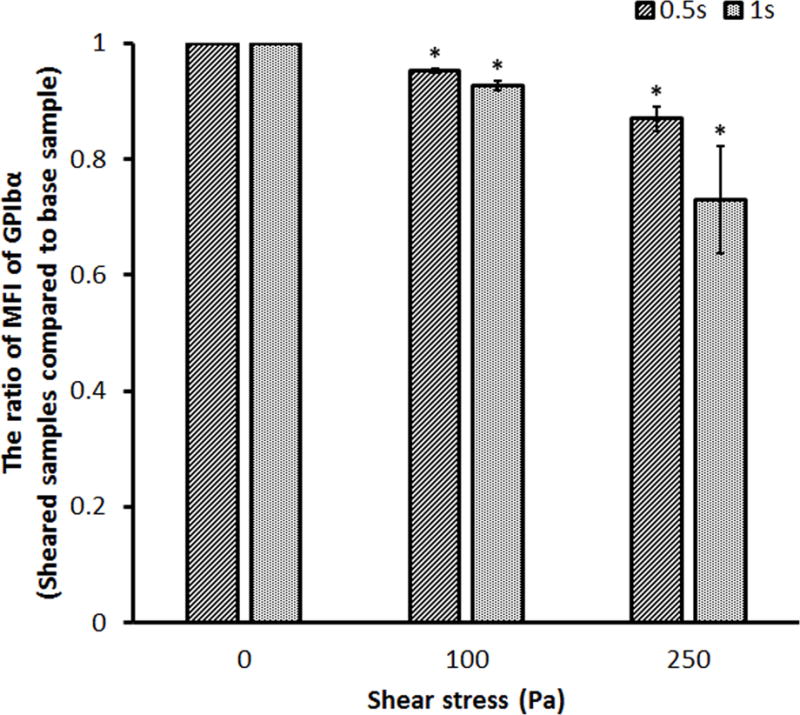
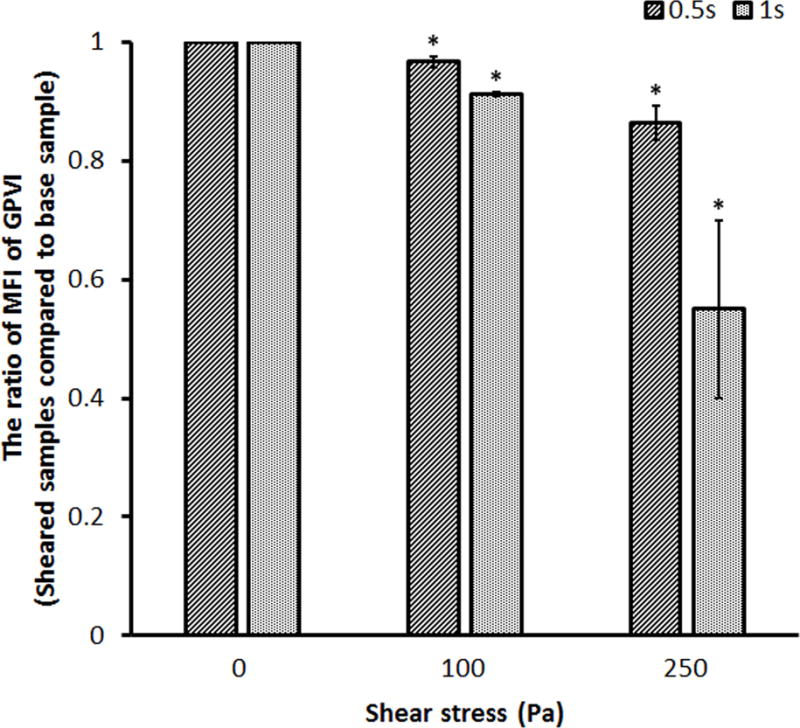
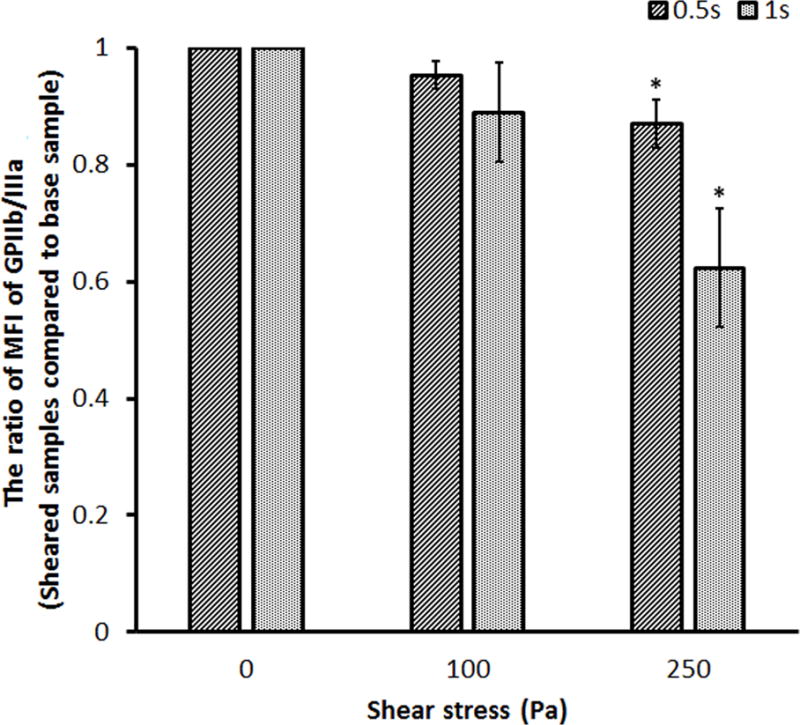
Figure 3.


Representative mean fluorescence intensity (MFI) ratios for the platelet (A) GPIbα, (B) GPVI and (C) GPIIb/IIIa receptors in the sheared blood samples relative to the baseline blood sample (0Pa/0s and 0Pa/0s) under four shear conditions (100Pa/0.5s, 100Pa/1s, 250Pa/0.5s and 250Pa/1s).
