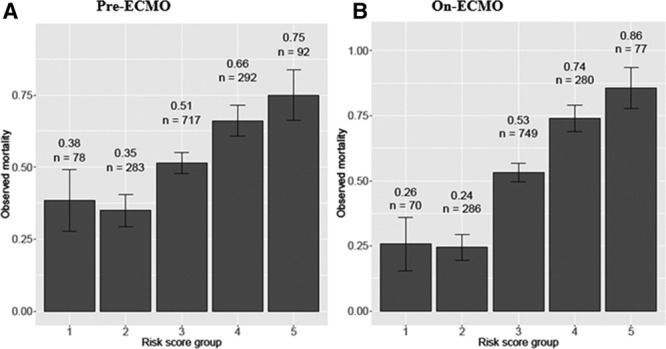
Figure 2.

Observed rate of mortality in the validation cohort according to the five risk score groups; n = number of patients in each of the five risk groups ((1) lowest 5%, (2) 5%–25%, (3) 25%–75%, (4) 75%–95%, and (5) highest 5% of the RS for both pre- and on-ECMO models). Error bar is the 95% confidence interval of death rate. ECMO, extracorporeal membrane oxygenation. A: Depicts risk groups per the pre-ECMO risk score. B: Depicts the risk groups per the On-ECMO risk score.
