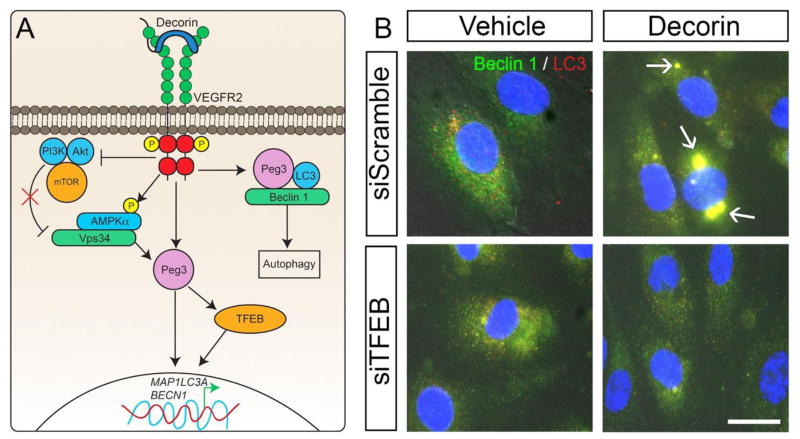
Fig. 1.
Schematic representation of decorin-evoked endothelial cell autophagy. (A) Mechanistic depiction of decorin-evoked endothelial cell autophagy downstream of VEGFR2. (B) Differential interference contrast (DIC) images of HUVEC treated for 6 hours of decorin (200 nM) upon silencing of TFEB, utilizing a specific siRNA, and probed for Beclin 1 (green) and LC3 (red). Arrows, in the top right panel, indicate the dually positive Beclin 1/LC3 autophagosomes as evoked by decorin in scramble transfected cells. Nuclei have been stained with DAPI (blue). All images were taken with the same exposure, gain, and intensity. Scale bar ~ 10 μm.

