FIGURE 1.

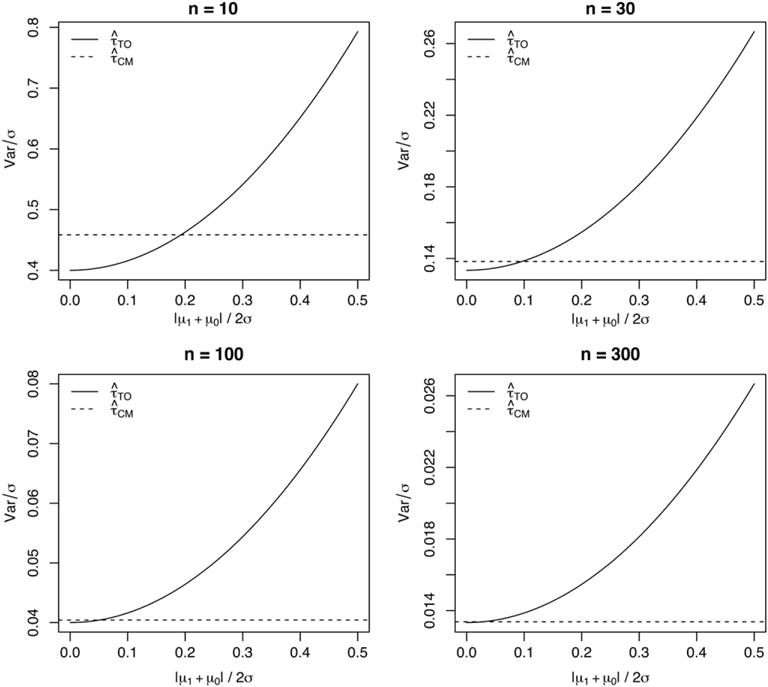
The variance of 2 average treatment effect estimators for n = 10, 30, 100, and 300, as the ratio of the absolute main effect |μ1 + μ0|/2 to the noise level σ increases from 0 to 0.5

The variance of 2 average treatment effect estimators for n = 10, 30, 100, and 300, as the ratio of the absolute main effect |μ1 + μ0|/2 to the noise level σ increases from 0 to 0.5