
FIGURE 10.
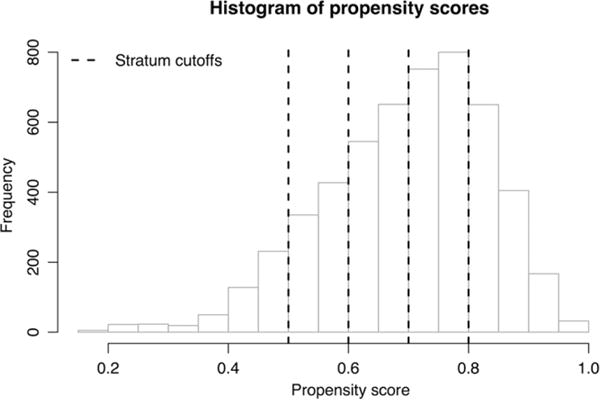
Histogram of propensity scores for real observational data application. The propensity score is the estimated probability that the patient would receive an A/B treatment (instead of a C/D treatment) based on the patient's covariates. Patients were binned into propensity score strata with cutoffs at 0.5, 0.6, 0.7, and 0.8