FIGURE 11.

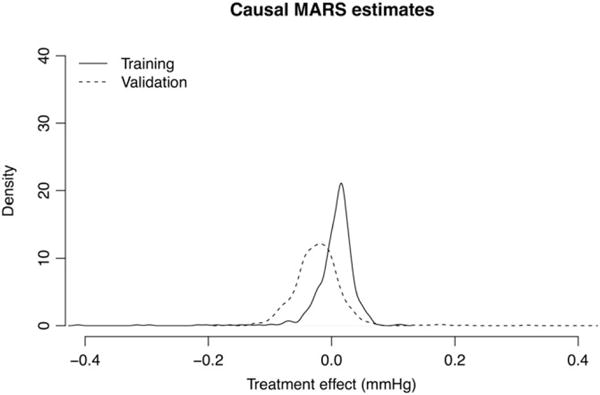
Densities of causal multivariate adaptive regression splines (MARS) treatment effect estimates in training and validation sets. The results on both data subsets agree that almost all personalized treatment effects are practically 0

Densities of causal multivariate adaptive regression splines (MARS) treatment effect estimates in training and validation sets. The results on both data subsets agree that almost all personalized treatment effects are practically 0