
FIGURE 2.
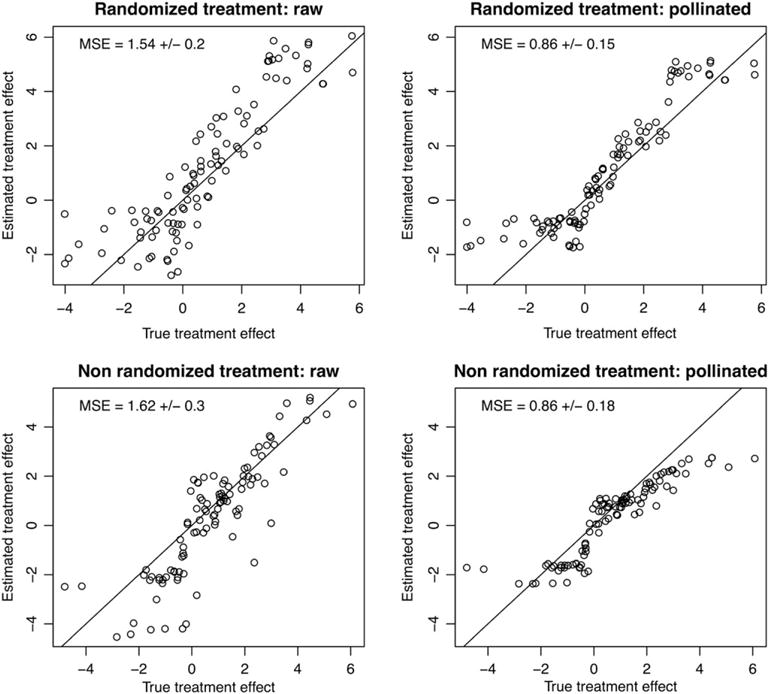
A comparison of raw and pollinated transformed outcome forests. Each method is applied to a randomized simulation and a nonrandomized simulation, and we visually compare the estimated treatment effect with the true treatment effect. We see that in each case, the pollination improves the estimates. For each method, we report the mean square error (MSE) for the treatment effect estimates, along with standard errors