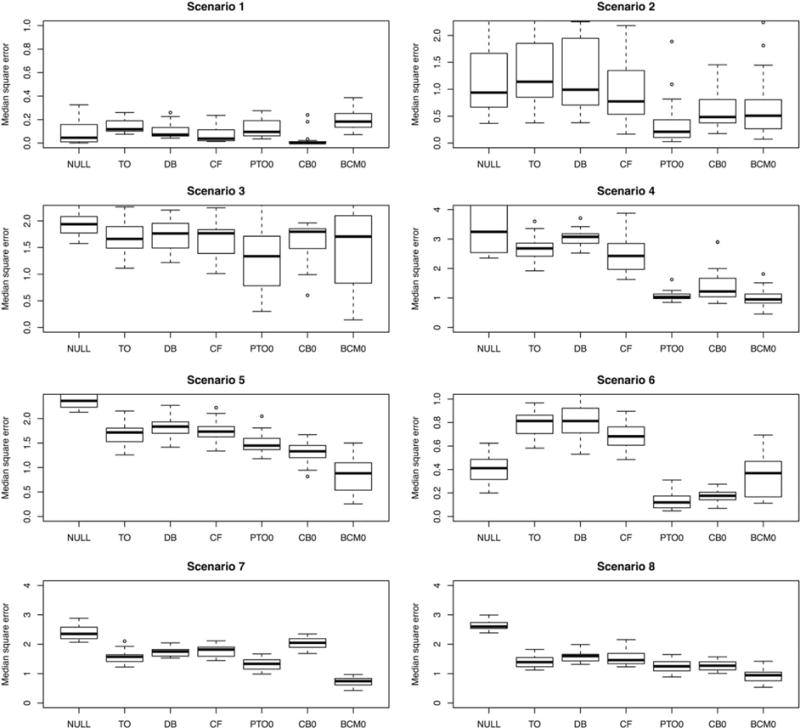
FIGURE 3.

Results across 8 simulated randomized experiments. For details of the generating distributions, see Table 1. The 7 estimators being evaluated are as follows: NULL = the null prediction, TO = transformed outcome forest, DB = different-basis forest, CF = causal forest, PTO0 = pollinated transformed outcome forest (using propensity = 1/2), CB0 = causal boosting, and BCM0 = causal MARS. The ranges of the y axis are chosen to start from 0 and be at least as great as the response standard deviation in each scenario while showing at least 95% of the data
