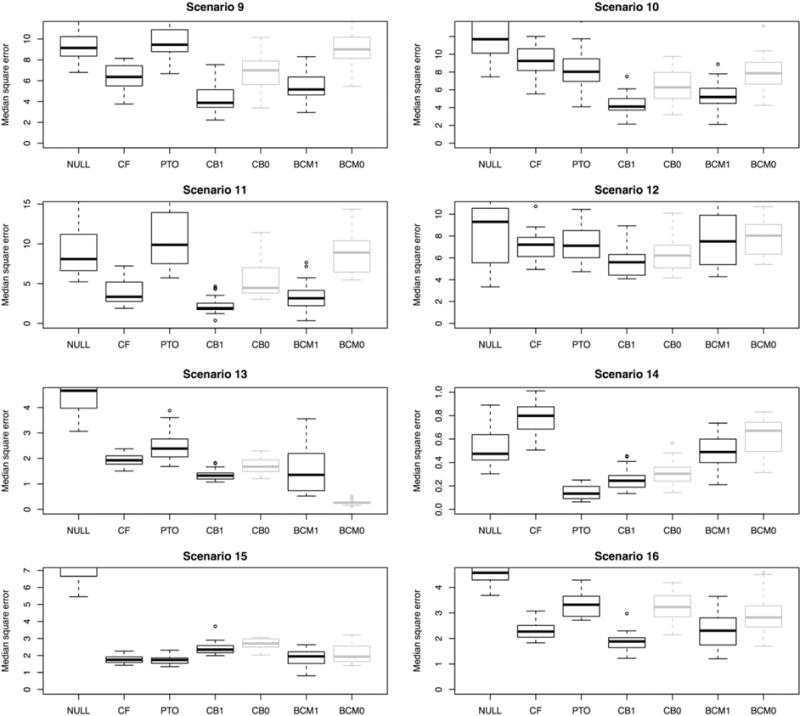
FIGURE 4.

Results across 8 simulated observational studies, in which treatment is more likely to be assigned to those with a greater mean effect. The 7 estimators being evaluated are as follows: NULL = the null prediction, CF = causal forest, PTO = pollinated transformed outcome forest, CB1 = causal boosting (propensity adjusted), CB0 = causal boosting, BCM1 = causal MARS (propensity adjusted), BCM0 = causal MARS. CB0 and CM0 are in gray because they would not be used in this setting. They are provided for reference to assess the effect of the propensity adjustment. The ranges of the y axis are chosen to start from 0 and be at least as great as the response standard deviation in each scenario while showing at least 95% of the data
