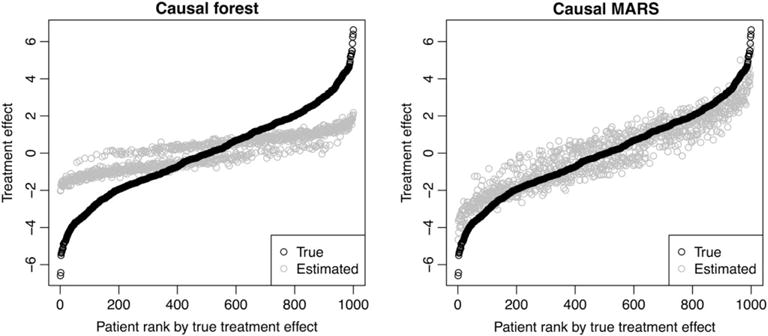
FIGURE 5.

Illustration of the bias of causal forest and causal multivariate adaptive regression splines (MARS). Patient features were simulated once, and then treatment assignment and response were simulated 50 times. Causal forest and causal MARS were applied to each of the 50 simulations, and the average estimate for each patient is plotted
