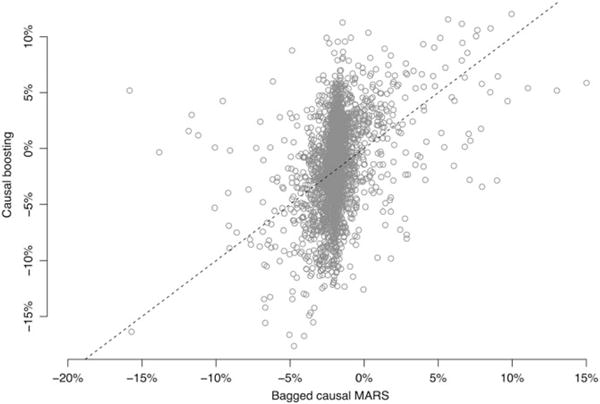
FIGURE 6.

Personalized treatment effect estimates from causal boosting and (bagged) causal multivariate adaptive regression splines (MARS). Each circle represents a patient, who gets a personalized estimate from each method. The dashed line represents the diagonal, along which the 2 estimates are the same
