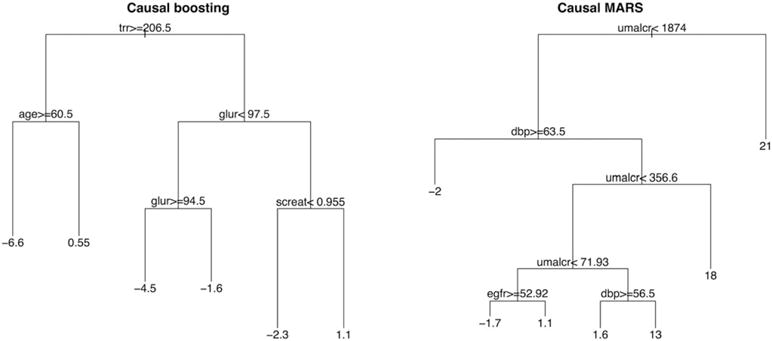
FIGURE 7.

Decision trees summarizing with broad strokes the inferences of causal boosting and (bagged) causal multivariate adaptive regression splines (MARS). The variables are as follows: trr = triglycerides (mg/dL) from blood draw; age = age (y) at beginning of trial; glur = glucose (mg/dL) from blood draw; screat = creatinine (mg/dL) from blood draw; umalcr = albumin/creatinine ratio from urine sample; dbp = diastolic blood pressure (mm Hg); egfr = estimated glomerular filtration rate (mL/min/1.73m2). If the inequality at a split is true for a patient, then that patient is on the left side of the split. The number in each terminal node is the estimated increase in risk due to treatment for a patient in that terminal node
