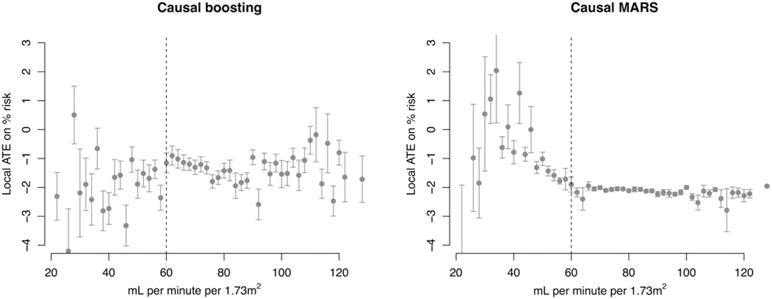
FIGURE 9.

Validation set personalized treatment effects, estimated via causal boosting and (bagged) causal multivariate adaptive regression splines (MARS), versus the estimated glomerular filtration rate. Patients are stratified according to the estimated glomerular filtration rate on the x axis, and each point gives the average personalized treatment effect among patients in that stratum. Error bars correspond to 1 standard error for the mean personalized treatment effect. The vertical dashed line represents a medical cutoff, below which patients are considered to suffer from chronic kidney disease. ATE, average treatment effect
