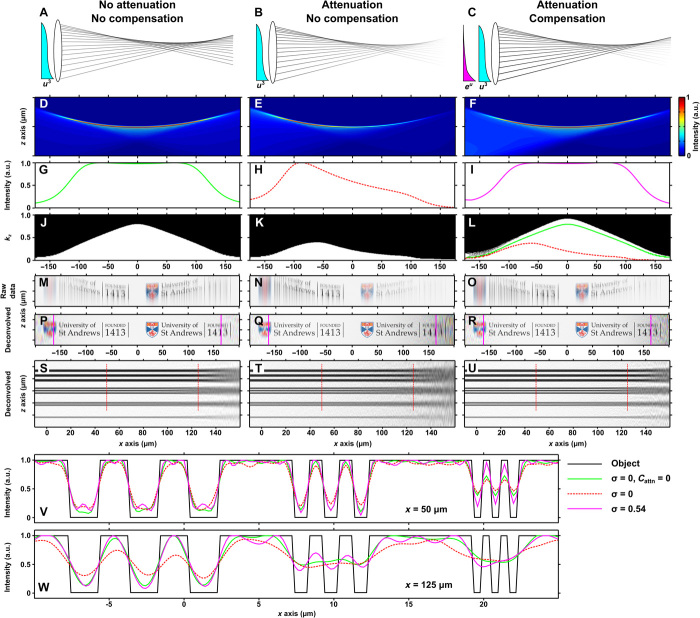
Fig. 1. Principle of attenuation-compensation for an Airy light sheet.
Ray optics representations of Airy light-sheet formation without (A) and with (B) attenuation (Cattn = 65 cm−1) and with attenuation-compensation (C; σ = 0.54). (D to F) Wave optical simulations of light-sheet profiles, (G to I) peak transverse intensity as a function of longitudinal coordinate, and (J to L) axial MTF thresholded at 5% contrast, respectively, for the light sheets shown in (A) to (C). Green and red lines in (L) match the 5% contour in (J) and (K), respectively. a.u., arbitrary units. (M to R) Simulated, recorded, and deconvolved images of the University crest and (S to U) simulated deconvolved images of a 1D resolution target, respectively, for the light sheets shown in (A) to (C). Pink solid lines in (P) to (R) indicate the edge of the FOV from theory. One-dimensional resolution target (P to R) has linewidth/spacing: 2 μm (top) and 1, 0.6, and 0.2 μm (bottom). (V and W) Intensity profiles through the dashed lines at x = 50 and 125 μm in (S) to (U). Simulation parameters were set to mirror experimental parameters (see Materials and Methods).

