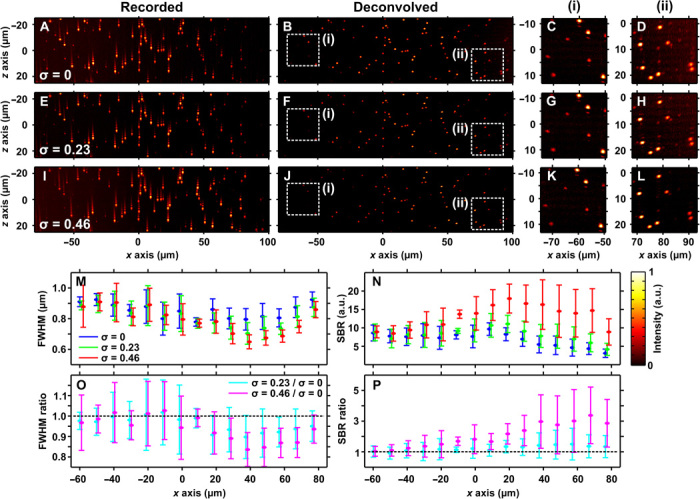
Fig. 3. Attenuation-compensated Airy LSM in an attenuating phantom.

Maximum intensity projections of recorded data (A, E, and I) and deconvolved images (B, F, and J) of sub–diffraction-limited fluorescent microspheres in an absorbing phantom with Cattn = 55 ± 1 cm−1. (A and B) No attenuation-compensation (σ = 0), (E and F) σ = 0.23, and (I and J) σ = 0.46 (full attenuation-compensation). (C, D, G, H, K, and L) Zoomed-in views of the regions indicated by the dashed boxes (i) and (ii) in (B), (F), and (J). (M and N) Axial resolution determined by FWHM of fluorescent microspheres and local SBR, respectively, as a function of light-sheet propagation (mean ± SD, 10-μm binning); σ = 0 (blue), σ = 0.23 (green), and σ = 0.46 (red). (O and P) Ratios of the graphs shown in (M) and (N); σ = 0.23/σ = 0 (cyan) and σ = 0.46/σ = 0 (magenta). Look-up tables of the images shown in (A) to (L) are independently scaled to the data shown.
