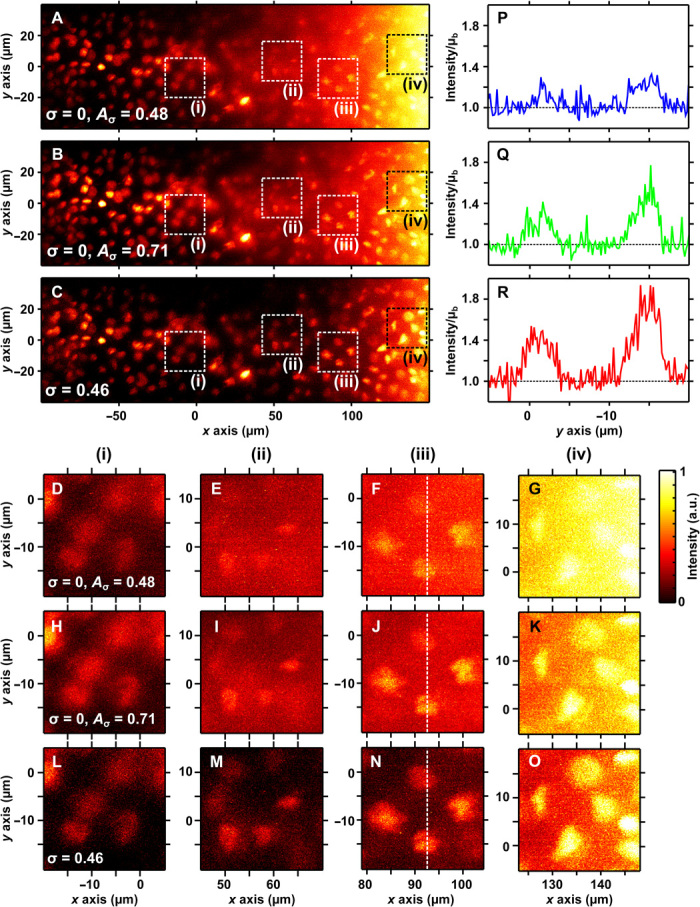
Fig. 5. Attenuation-compensated Airy LSM in S. lamarcki opercula.

Maximum intensity projections of deconvolved Airy LSM images of nuclei stained with PI in the operculum of S. lamarcki (attenuation estimated at 75 cm−1) with (A) no attenuation-compensation, (B) no attenuation-compensation but the same total power as a compensated light sheet (σ = 0.46), and (C) σ = 0.46. (D to G) Zoomed-in views of the region indicated by dashed boxes (i) to (iv) in (A). (H to O) Same regions from (B) and (C). Intensity profiles along the dashed line in (F), (J), and (N) are shown in (P) to (R), respectively. Line intensity profiles are shown relative to the noise floor, given by the local mean background μb.
