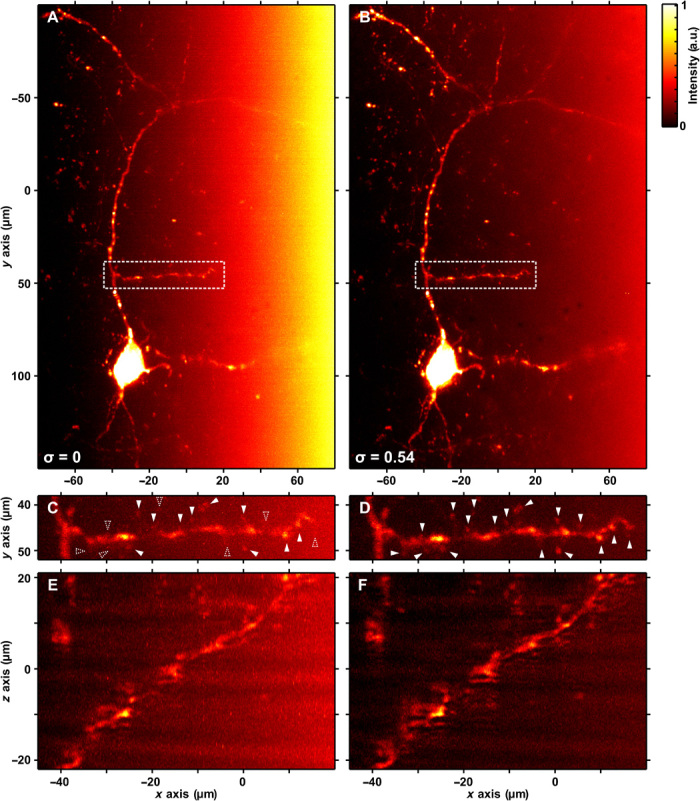
Fig. 6. Attenuation-compensated Airy LSM in mouse brain section.

Maximum intensity projections of deconvolved Airy LSM images of kisspeptin neurons expressing mCherry in the hypothalamic arcuate nucleus of a mouse brain (attenuation estimated at 100 cm−1) with (A) no attenuation-compensation and (B) σ = 0.54. (C and D) Expanded views of the region indicated by the dashed box in (A) and (B). (E and F) Orthogonal projections of the regions shown in (C) and (D). Filled arrowheads indicate the positions of dendritic spines in (C) and (D). Dashed arrowheads in (C) indicate the position of dendritic spines not identified without attenuation-compensation.
