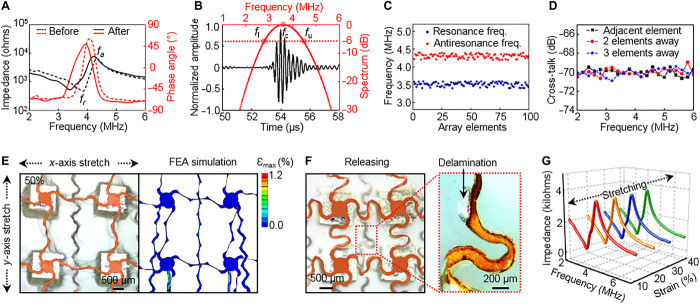
Fig. 2. Characterizations of piezoelectric and mechanical properties.
(A) The impedance and phase angle spectra of the 1-3 composite before and after processing, showing good electromechanical coupling of the fabricated transducer (keff, ~0.60; θ, ~50°). (B) Pulse-echo response and frequency spectra, with a short spatial pulse length (~1.94 μs), a high SNR (~20.24 dB), and a wide bandwidth (~47.11%). (C) The resonance and antiresonance frequency variations of the 100 transducer elements. The mean values/SDs are 3.51 MHz/56.8 kHz (resonant) and 4.30 MHz/59.1 kHz (antiresonant), respectively. The 100% yield demonstrates fabrication robustness. (D) Average cross-talk levels between elements that are adjacent, two elements away, and three elements away, showing the outstanding anti-interference capacity of the device. (E) The optical image (left) and corresponding finite element analysis (FEA) simulation (right) of a 2 × 2 array under 50% biaxial tensile strain, showing its excellent stretchability. The local strain level (maximum principal strain) in the interconnects is indicated by the color scale. (F) The optical image after releasing the biaxial strain of 50%. The zoomed-in image highlights plastic deformation and local delamination of the interconnects upon loading/unloading. (G) Electrical impedances of the transducer under different strain levels, showing the mechanical stability of the device.

